Daily Snapshot [March 01, 2019] – FX, Oil, T-Note, Bund, S&P5003 min read
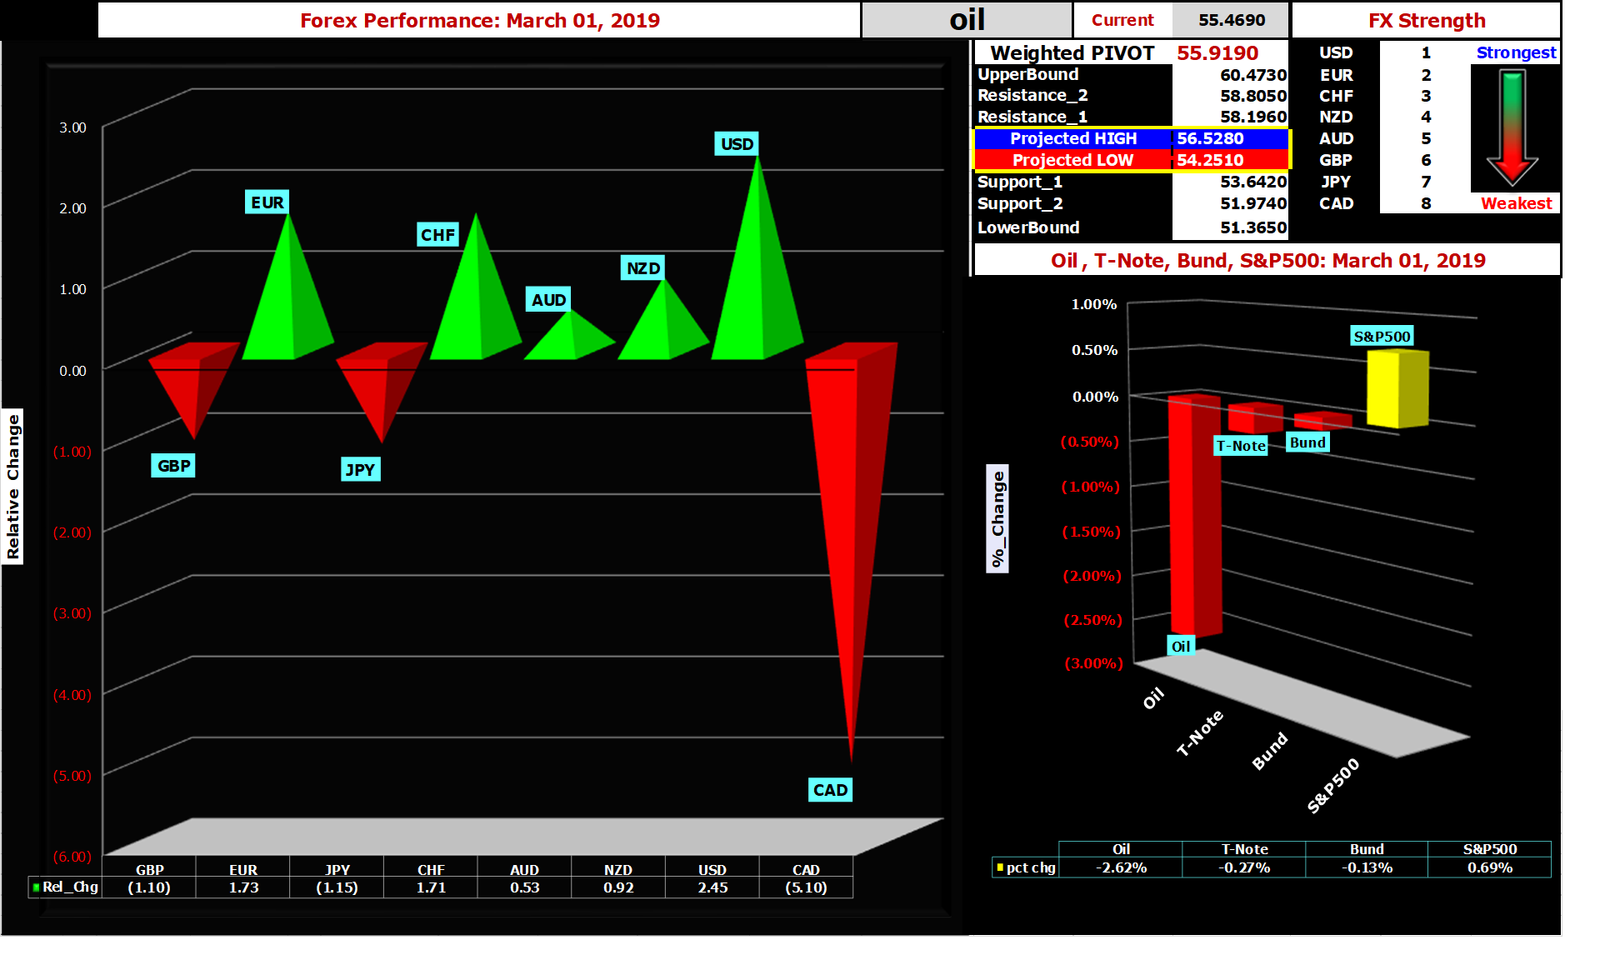
March 01, 2019 – Market review and metrics for Forex, Oil, T-Note, Bund, S&P500.
Pivot points, Support, Resistance & Fibonacci Reversal levels; Chart of Interest – <OIL_WTI>. {updated 5PM EST }
| FX Performance (Strongest to Weakest) |
| Strongest | Weakest |
| USD | EUR | CHF | NZD | AUD | GBP | JPY | CAD |
| Best Performer | Worst Performer |
| USDCAD | CADCHF |
- Market performance (DAILY)

Market Performance (click to enlarge)
| Market | Comments |
| Forex | US Dollar was the best performer on the first trading day in March as risk appetite came to the fore. While the reasons for optimism are not exactly clear given the lackluster data emanating from the major economic zones, what is clear is that there was broad based support for the US unit. Maybe its a question of relativity, a case of “the prettiest girl at an ugly girl party”. The Canadian currency was the worst performer today as a weaker than expected Q4 GDP release and the precipitous drop in the price of oil, their most important export, gave traders the leeway to sell it with gusto. |
| S&P500 | Consolidation was the dominant theme for the past few session but it appears that the S&P500 index wants to have a go at the upper end of the resistance zone between 2800-20. The consensus is that constructive talks are taking place as negotiators try to hammer out an agreeable trade deal between the worlds’ two largest economies. Nonetheless recent price action suggests that the markets are not convinced that new highs are warranted especially given that valuations based on 2019 EPS estimates would continue to become more expensive as the price rises. |
Oil & Yields
| The month of March started with Oil falling sharply. Given the sharp rally from the lows ($42.34) it would be normal to expect some profit taking ahead of the weekend especially as the battle between bulls and bears intensifies, but a few other events have investors questioning the cause for this move lower. First, the US Energy Department released 6 million barrels of emergency stock from the Strategic Petroleum Reserve (SPR.) which prompted speculation that this was a counter to OPEC’s production cuts and to offset lowered supply from Iran and Venezuela due to US sanctions. Also Alberta, Canada’s main oil-producing province, raised by 100,000 bpd the amount of crude that companies can produce in April. This move raised fears that weaker domestic economic prospects were behind the move to capture market share at the expense of higher prices to meet existing international demand. Finally, continuing evidence that Chinese growth remains anemic and a Reuters poll showing analysts expect global fuel consumption to decrease worldwide renewed worries about future demand. US 10Yr yields were higher again as investors reassess the state of FED action.. |
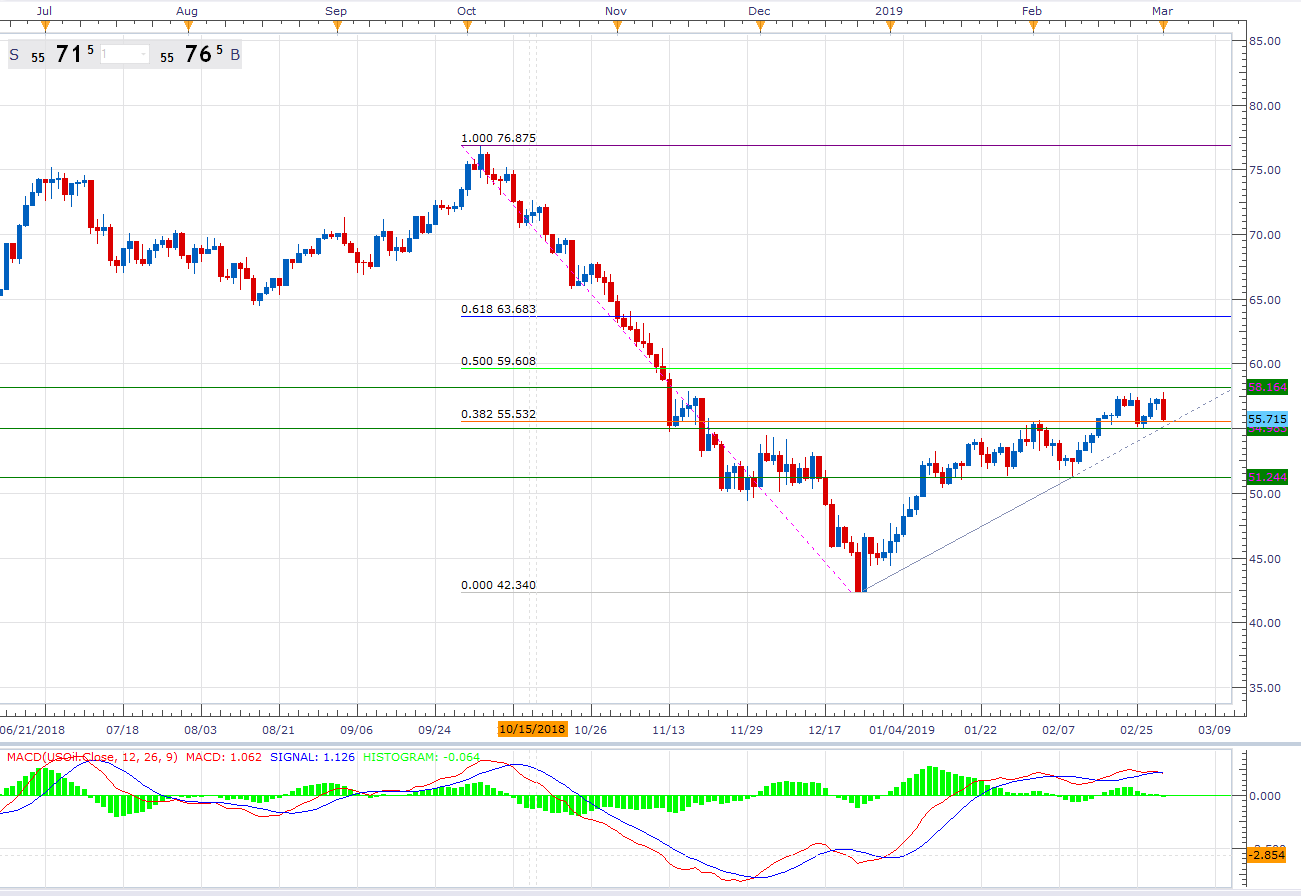
- Chart of Interest – Oil_WTI (Daily)
Whether its one or all of the factors outlined above or something else entirely, price action shows that $58 rebuffed the rally from the down move ($76.88 to $42.34) and a double top reversal pattern looks to be forming. Should price break the dynamic ascending trend line at $55.4 then moderate support (also the double top neckline) comes in around $55. A breach of this could see the market target $50 and would bring the bears out of hibernation.
(click to enlarge)
- Pivot Points & Fibonacci Retracement Levels
A technical analysis indicator used to try and determine the short-term trend of the market. The pivot point is the average of the high, low and closing prices from the previous trading period. If the market on the following period trades above the pivot point it is thought to be exhibiting bullish sentiment, whereas trading below the pivot point is seen as bearish. The Fibonacci retracement is the potential reversal of a financial instrument’s original move in price.
Market Metrics (click to enlarge)


