
February 26, 2019 – Market review and metrics for Forex, Oil, T-Note, Bund, S&P500. Pivot points, Support, Resistance & Fibonacci Reversal levels; Chart of Interest – GBPUSD. {updated 5PM EST }
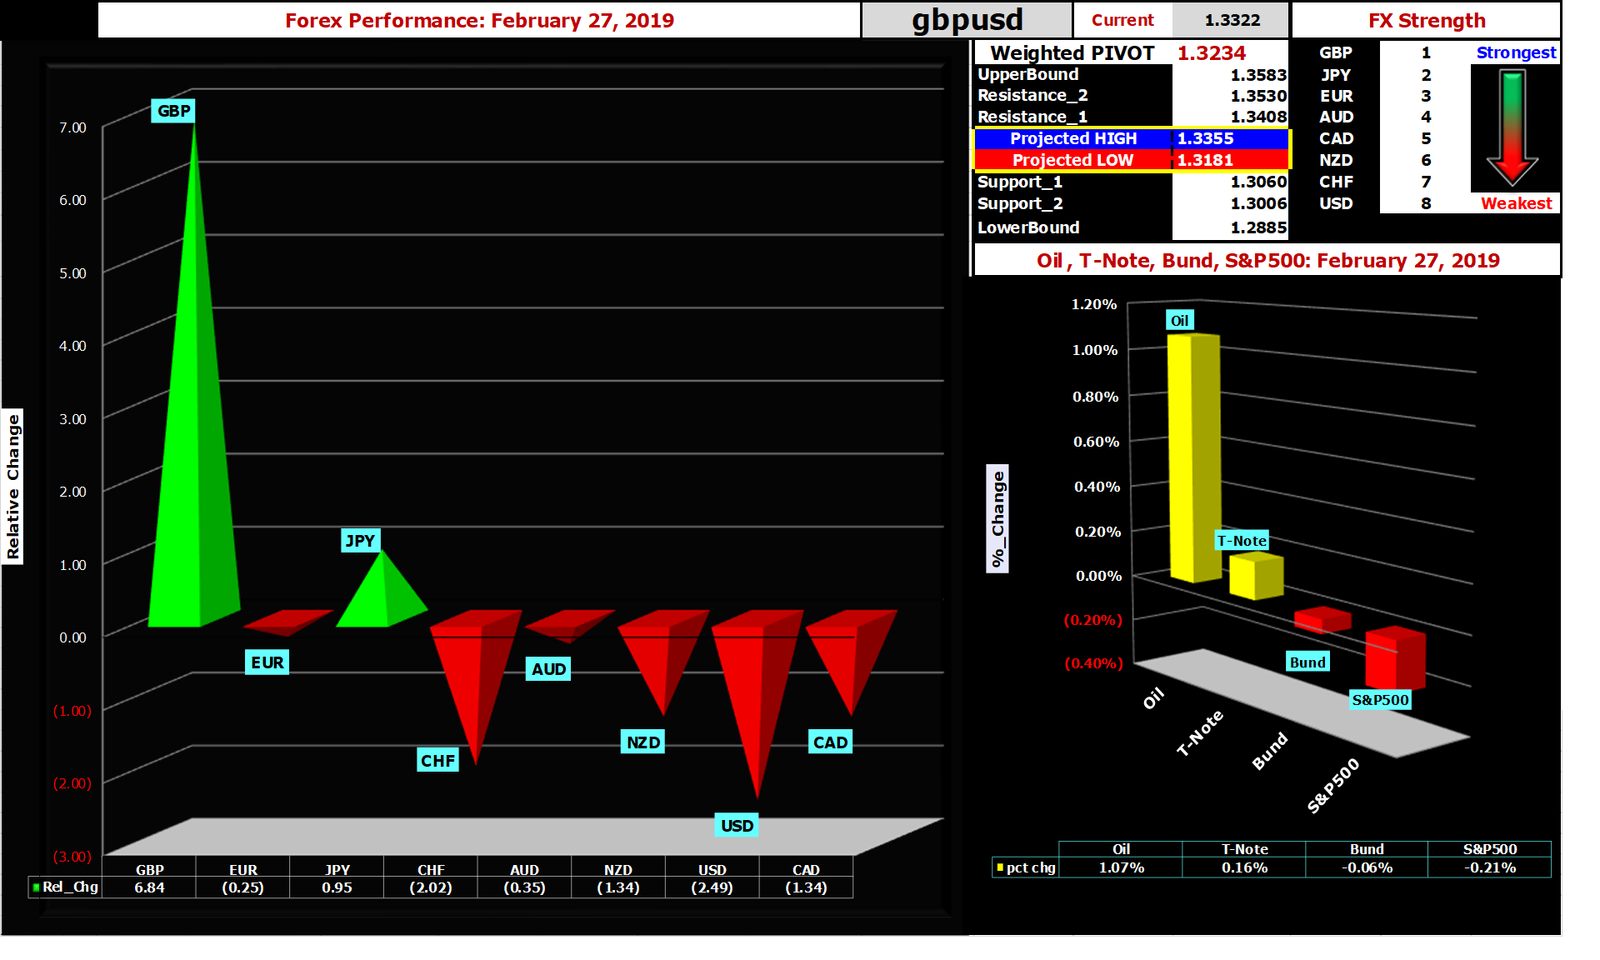
| FX Performance (Strongest to Weakest) | |||||||
| Strongest | Weakest | ||||||
| GBP | JPY | EUR | AUD | CAD | NZD | CHF | USD |
| Best Performer | Worst Performer |
| GBPUSD | EURGBP |
- Market performance (DAILY)

Market Performance (click to enlarge)
| Market | Comments |
| Forex | The Great British Pound surged as PM Theresa May announced that there would be three different parliamentary votes regarding Brexit. First will be another vote on the Brexit withdrawal deal slated to be held no later than March 12. If this fails then the second vote will be on “no-deal” Brexit scheduled for March 13. If both fail then the last vote for a delay will take place on March 14. All in all the days preceding the Ides of March look fraught with volatility. Citing “conflicting signals” FED chair Powell reinforced the growing notion that the FOMC has moved out of its tightening phase and is on hold for the foreseeable future. This dovish tilt sent yields and USD lower. |
| S&P500 | S&P500 was marginally lower as the rally seems to have run out of steam consolidating just below moderate resistance at 2818. |
| Oil | Crude oil prices rose as OPEC intimated that they would stick with production cuts in spite of President Trump’s opposition to that plan. |
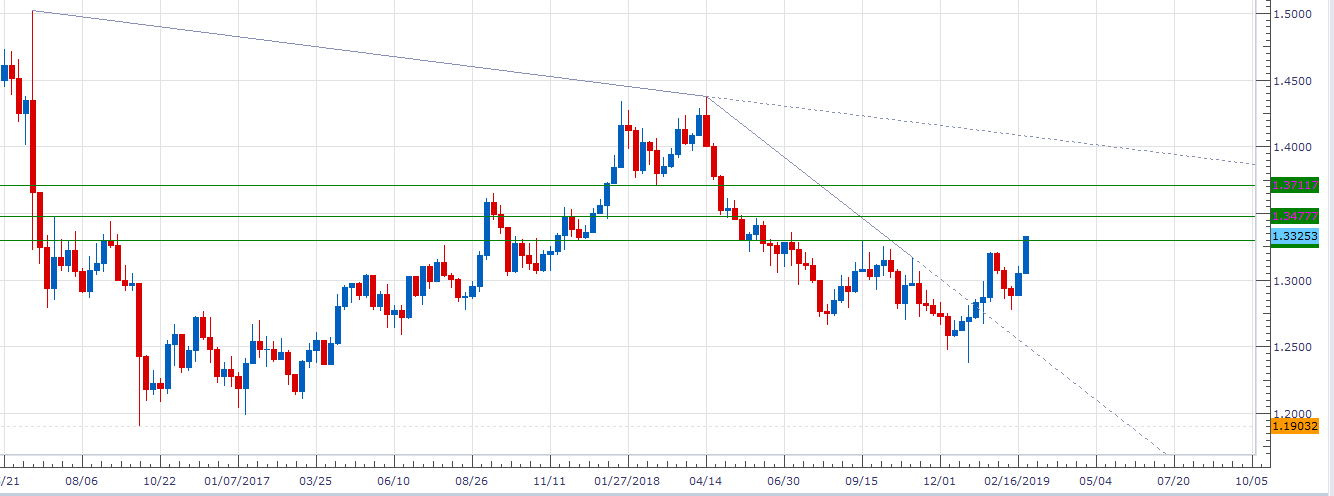
- Chart of Interest – GBPUSD
The price action over the past few weeks appears to be carving out an “inverse head & shoulder” technical pattern. For this to come to fruition, a clear breach of the neckline which comes in around 1.33 would be needed. A move to 1.3480 should follow in short order before 1.3720 comes into play. Clearly Brexit machinations will exert influence on price action but the fact that the “no deal” Brexit option has lost support should favor a higher GBP in the short term.
(click to enlarge)
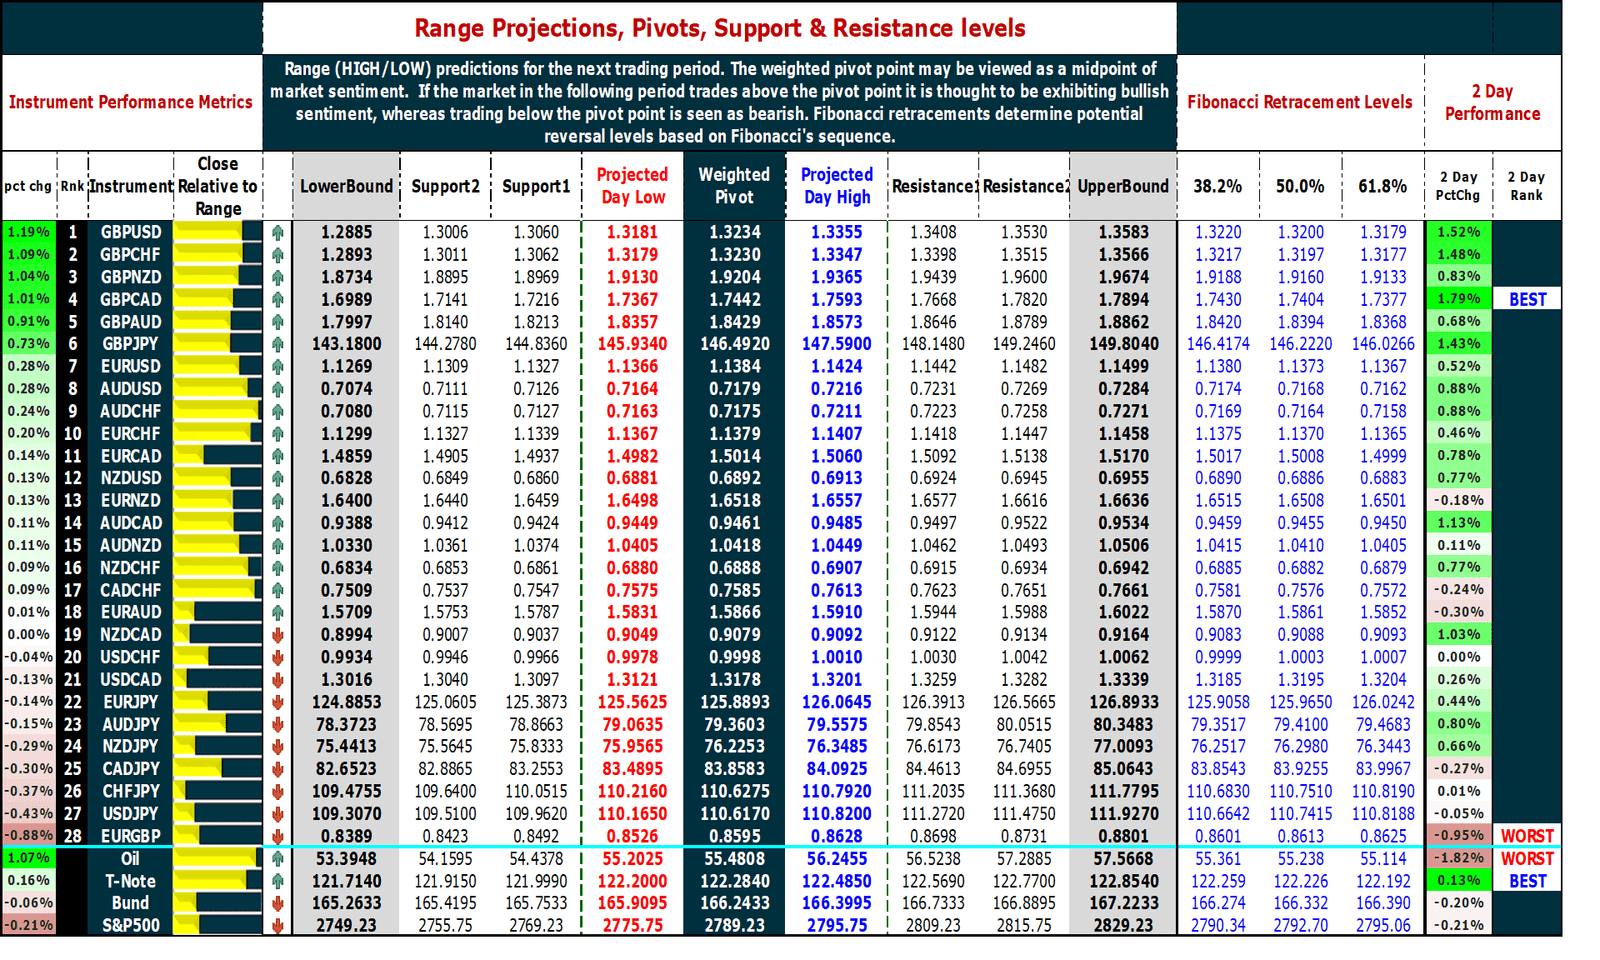
- Pivot Points & Fibonacci Retracement Levels
A technical analysis indicator used to try and determine the short-term trend of the market. The pivot point is the average of the high, low and closing prices from the previous trading period. If the market on the following period trades above the pivot point it is thought to be exhibiting bullish sentiment, whereas trading below the pivot point is seen as bearish. The Fibonacci retracement is the potential reversal of a financial instrument’s original move in price.Market Metrics (click to enlarge)
Recent Comments