
February 27, 2019 – Market review and metrics for Forex, Oil, T-Note, Bund, S&P500. Pivot points, Support, Resistance & Fibonacci Reversal levels; Chart of Interest – <US Crude Oil> {updated 5PM EST }
| FX Performance (Strongest to Weakest) | |||||||
| Strongest | Weakest | ||||||
| GBP | CAD | USD | CHF | EUR | JPY | AUD | NZD |
| Best Performer | Worst Performer |
| GBPNZD | NZDCAD |
- Market performance (DAILY)

Market Performance (click to enlarge)

| Market | Comments |
| Forex | GBP continued its rise buoyed by investors pricing in a more agreeable Brexit deal than the disaster that was looming with the “no deal Brexit” scenario. The first vote which is a SECOND vote on the Brexit withdrawal agreement is scheduled for March 12. If this fails then the next vote will be on “no-deal Brexit” which requires parliamentary consensus thus making it harder to pass. This fact appears to be the impetus beneath the Pounds rally. If both fail then the last vote for a delay will take place on March 14. While near term momentum is bullish the currency will be quite sensitive to rhetoric ahead of these crucial votes. FED chair Powell stayed on message that the FOMC is on hold for the foreseeable future as he concluded his two day testimony before Congress. He also offered that the FED is “close to agreeing on a plan” to end its balance sheet draw down which seems to imply that they are cognizant of the effect their moves might have on the stock markets. The “Powell put” appears to be still in play which should underpin equities a bit. |
| S&P500 | S&P500 was marginally higher but appears to be consolidating below moderate resistance at 2818. US Trade Representative Robert Lighthizer doused the rising optimism of the market that appeared to be pricing in a trade deal between US and China. |
| Oil | Crude oil prices surged after EIA report showed that inventories fell sharply. Whether this is evidence of rising demand or a byproduct of OPEC’s production cuts remains to be seen. |
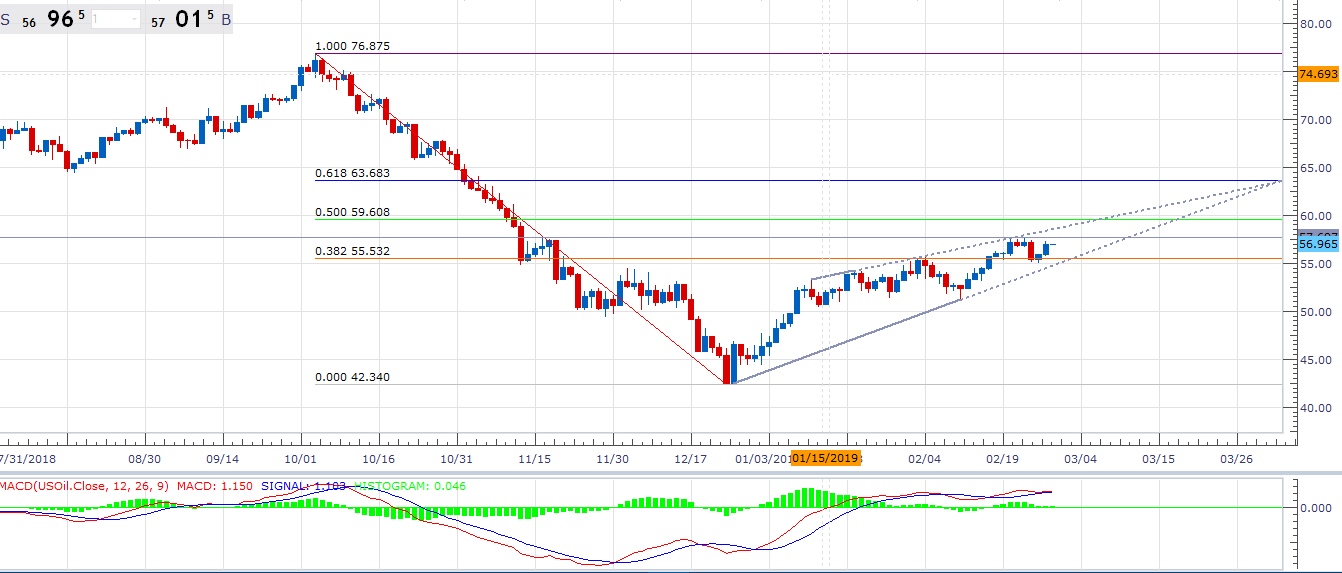
- Chart of Interest – Oil_WTI
WTI crude oil ratcheted higher after bullish inventory data as it takes aim at near term resistance at 57.45. A successful breach would bring 57.95 into focus and more importantly pave the way for a test of the 50% retracement level of the move from 76.88 to 42.34.
OIL (click to enlarge)
- Pivot Points & Fibonacci Retracement Levels
A technical analysis indicator used to try and determine the short-term trend of the market. The pivot point is the average of the high, low and closing prices from the previous trading period. If the market on the following period trades above the pivot point it is thought to be exhibiting bullish sentiment, whereas trading below the pivot point is seen as bearish. The Fibonacci retracement is the potential reversal of a financial instrument’s original move in price.Market Metrics (click to enlarge)

Recent Comments