February 28, 2019 – Market review and metrics for Forex, Oil, T-Note, Bund, S&P500.
Pivot points, Support, Resistance & Fibonacci Reversal levels; Chart of Interest – <S&P500>. {updated 5PM EST }
| FX Performance (Strongest to Weakest) | |||||||
| Strongest | Weakest | ||||||
| CHF | EUR | USD | CAD | JPY | GBP | NZD | AUD |
| Best Performer | Worst Performer |
| CHFJPY | AUDCHF |
- Market performance (DAILY)

Market Performance (click to enlarge)

| Market | Comments |
| Forex | US advance GDP for the last quarter of 2018 came out at 2.6% q/q beating market expectations but below the 3.0% that the Trump administration has set as a benchmark. This release, though delayed due to the government shutdown, was enough to give the USD a bid but probably not enough to alter the FOMC’s thought process. India – Pakistan tensions saw funds flow into the Swiss Franc- the de facto safe haven currency while month end demand and a growing optimism about the Euro zone economy gave a boost to the Euro. As has been the case for a while now any concerns about China will have an effect on the antipodeans (AUD, NZD) . |
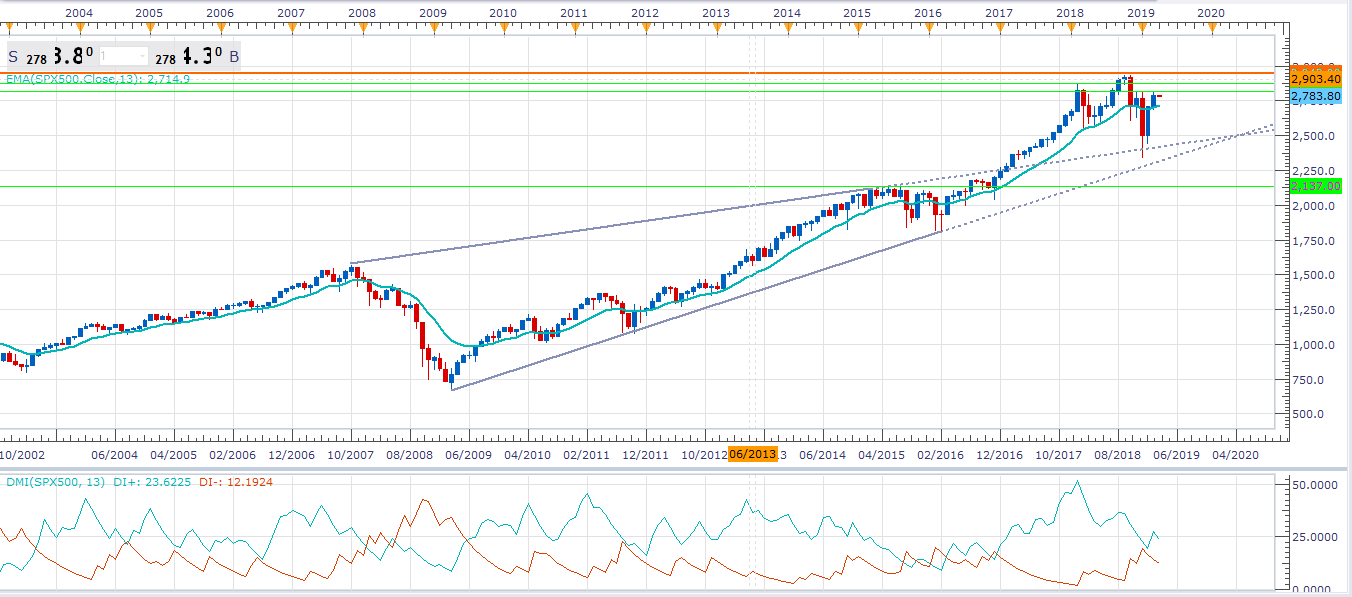
| S&P500 | Consolidation was the dominant theme as S&P500 ended February below 2800. It might just take some serious progress in U.S.-China trade talks for the index to breach what is turning out to be a strong resistance zone between 2800-20. The repeated attempts to surpass this level have been thwarted which leads one to suspect that the markets are not convinced that new highs are warranted especially given that valuations based on 2019 EPS estimates are quite high. |
| Oil & Yields | Crude oil prices were marginally higher as price stair-steps its way towards key resistance at $57.43. OPEC along with Russia appear determined to stick with production cuts which should underpin prices but an increase in US shale oil production might see bears re-emerge. US 10Yr yields rose after the better than expected US GDP print stemmed recessionary fears, for now. |
- Chart of Interest – S&P 500 (Monthly)

(click to enlarge)
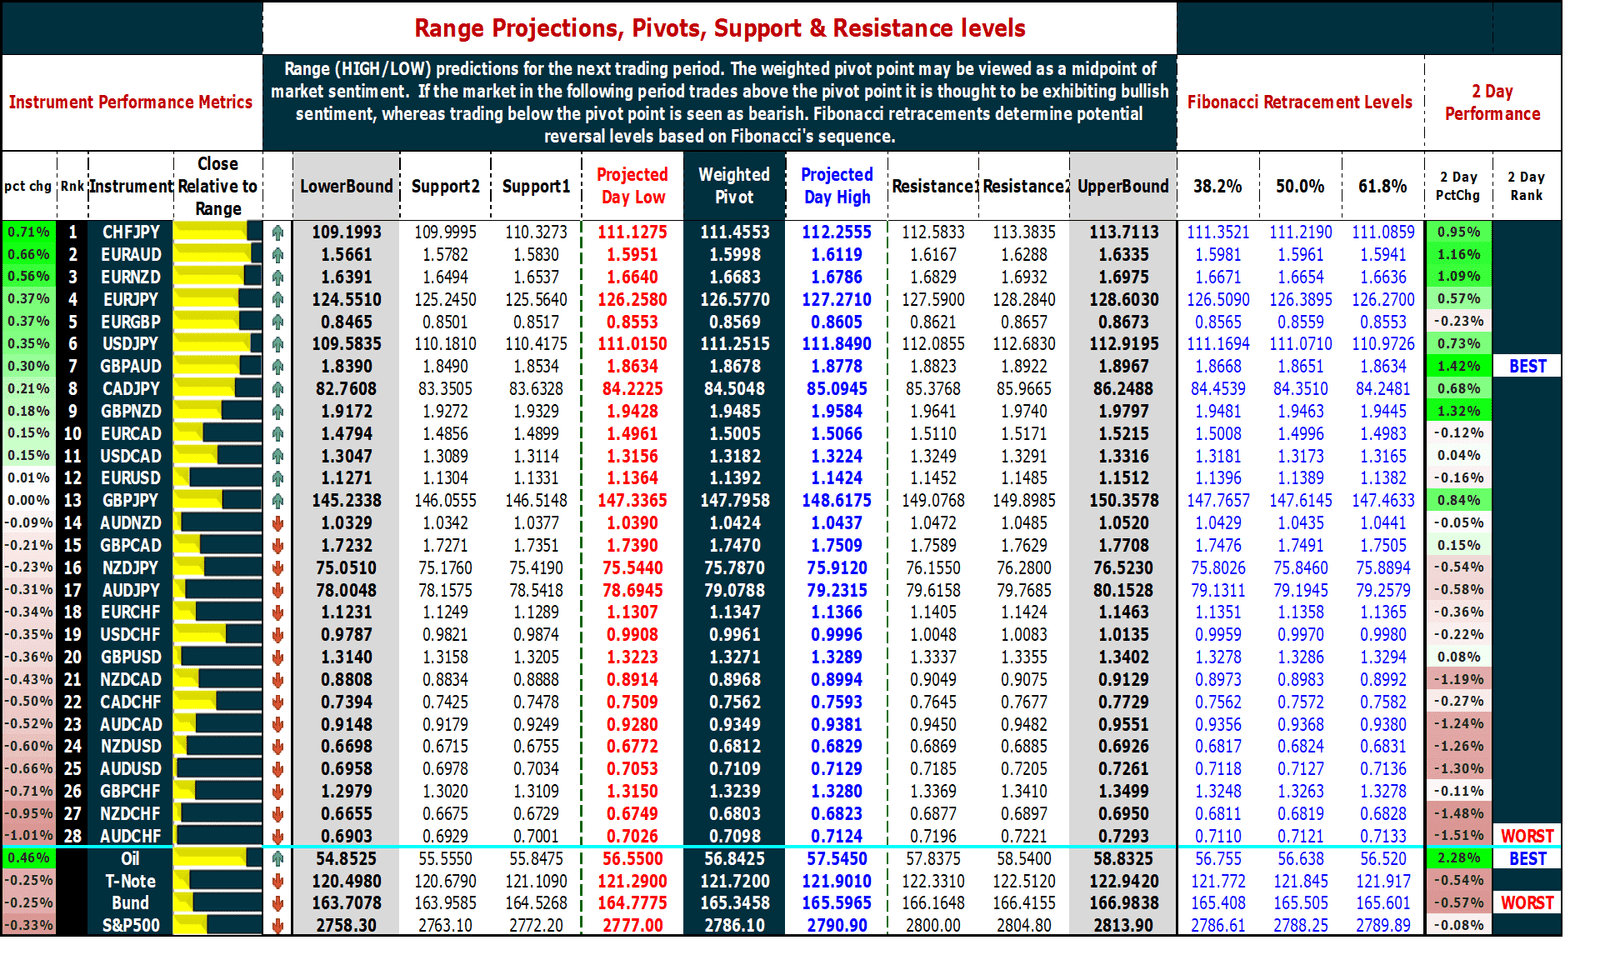
- Pivot Points & Fibonacci Retracement Levels
A technical analysis indicator used to try and determine the short-term trend of the market. The pivot point is the average of the high, low and closing prices from the previous trading period. If the market on the following period trades above the pivot point it is thought to be exhibiting bullish sentiment, whereas trading below the pivot point is seen as bearish. The Fibonacci retracement is the potential reversal of a financial instrument’s original move in price.Market Metrics (click to enlarge)
Recent Comments