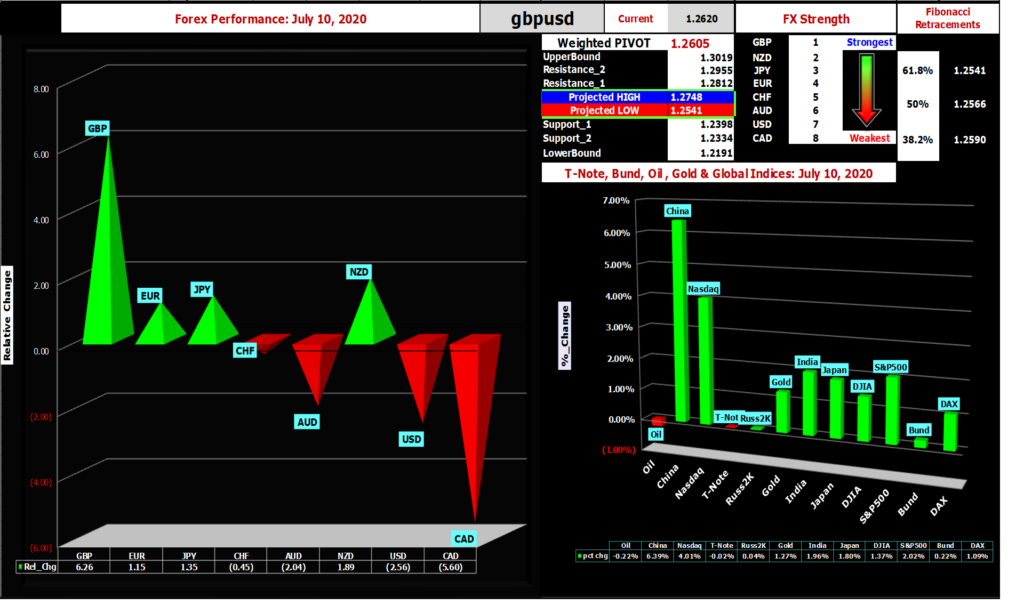
July 11, 2020 – Market review and metrics for FX, Oil, Gold, Global Indices & Yields. Pivot points, Support, Resistance & Fibonacci Reversal levels and Chart of Interest (Russell 2000).
- Global markets overview (Weekly)

Strongest
Weakest
| GBP | NZD | JPY | EUR | CHF | AUD | USD | CAD |
| Best Performer | Worst Performer | |
|---|---|---|
| FX | GBPCAD | CADJPY |
| Global Index | China A50 | Russell 2000 |
- Global markets commentary (Weekly)
| Market | Comments |
|---|---|
| FX | The pound (GBP) was the strongest performing major for the week ending July 10, 2020 while the “loonie” (CAD) was the weakest. The rest of the majors appeared content to dither around in fairly tight ranges, a sure sign that traders lacked the impetus to be aggressive in their views. For a while now the pound’s fate has been inextricably tied to BREXIT, where any whiff of a deal gets the bulls excited and setbacks bring the bears out of hibernation. Factor in COVID-19, the pandemic that continues to wreak havoc on the global economy, and it becomes clear that “chopping” around in ranges might be whats in store for the FX markets for the foreseeable future. With this in mind, the decision by Chancellor Sunak to further support the UK economy as it attempts to re-open, with measures such as incentivizing Britishers to go out and eat, coupled with cautious optimism in UK-EU trade talks might well be the reason for the pound’s recent strength. The Canadian dollar ended the week on the back foot even though their headline employment data beat market expectations. The details were not as upbeat which is hardly surprising given that COVID-19 continues its assault globally (aided greatly by the sheer incompetence of certain regimes). The most likely cause for the weakness could be that the resurgence of COVID-19 cases, especially in US, has brought to fore the prospects of a protracted global economic malaise which would hit commodity driven currencies, like the CAD, especially hard. The upcoming week should see a bit more volatility as monetary policy statements from BOJ (Japan), BOC (Canada) and ECB (EU) along with Australian employment data, Chinese GDP, New Zealand CPI (important as it is released on a quarterly basis), and US retail sales should keep the markets engaged. |
| Global Indices | Global indices, by and large, have staged impressive rebounds following the COVID-19 induced cratering in March 2020. But all rebounds have not been equal as can be seen in the relative performances of Nasdaq 100 and Russell 2000. Both are up from their mid-March lows, but the tech heavy, large cap dominated Nasdaq has clearly outperformed the small-cap intensive Russell (see chart below). This may offer the clearest picture of what the new “normal” might look like. Under the guardedly optimistic assumption that COVID-19 will be contained (eventually?), there will be some seismic changes in the global economic paradigm. For one thing, working remotely will likely be more prevalent than it had been pre-pandemic as will changes in the social behaviors of a consumer who has been literally “scared to death”. This will negatively affect sectors that are disproportionately saturated with companies catering to small businesses, such as restaurants, bars, gyms, movie theaters, and retail stores. Conversely, technology companies, especially ones that are already established (Amazon, Netflix) and can satisfy the demands of a consumer that is more “socially distant”, will likely see a boost to their bottom line. |
| Oil, Gold & Yields | Crude oil (WTI) was marginally lower as worries about global demand resurfaced. Gold was higher on safe-haven buying. US 10Yr yields continued their incessant decline, buoyed by deflation fears, as the increasing rate of COVID-19 cases in major US states gives rise to talk of renewed shutdowns. |
- Chart(s) of Interest – Russell 2000 (Weekly) & Nasdaq 100 {Source: TradingView}
Essentially a “story” of three key levels that roughly correspond to the most used fibonacci retracement levels, namely 38.2% (1250), 50% (1350), and 61.8% (1450). A breach of 1450 will bring recent rebound high of 1536 into play. The inability to pierce the 61.8% resistance will likely see range-bound trading between 1250- 1450.
- Pivot Points & Fibonacci Retracement Levels
A technical analysis indicator used to try and determine the short-term trend of the market. The pivot point is calculated from the previous trading periods’ price action. If the market on the following period trades above the pivot point it is thought to be exhibiting bullish sentiment, whereas trading below the pivot point is seen as bearish. The Fibonacci retracement is the potential reversal of a financial instrument’s original move in price.


Recent Comments