Lookback Period: 1 Month
2-Year Yield: -0.20 bp
10-Year Yield: -0.15 bp
S&P 500: -1.1% (7,706 → 7,624)
1. Current Sector Performance
| GICS Sector |
Avg Return % |
Median Return % |
# stocks |
Avg Vol % |
Avg MaxDD % |
| Energy |
9.22 |
9.75 |
21 |
28.72 |
-5.18 |
| Utilities |
7.23 |
8.32 |
31 |
23.06 |
-3.47 |
| Consumer Staples |
7.06 |
7.77 |
33 |
27.86 |
-4.34 |
| Health Care |
6.82 |
7.71 |
60 |
28.74 |
-5.07 |
| Consumer Discretionary |
3.47 |
4.25 |
47 |
32.03 |
-6.35 |
| Financials |
2.99 |
3.37 |
75 |
24.25 |
-5.30 |
| Real Estate |
2.47 |
2.94 |
30 |
26.04 |
-5.25 |
| Materials |
0.92 |
3.37 |
24 |
24.22 |
-6.65 |
| Industrials |
0.35 |
1.59 |
83 |
29.32 |
-7.52 |
| Information Technology |
-3.37 |
-2.50 |
75 |
48.53 |
-15.56 |
| Communication Services |
-3.56 |
-4.51 |
22 |
35.97 |
-9.91 |
2. Prior Sector Performance
| GICS Sector |
Avg Return % |
Median Return % |
# stocks |
Avg Vol % |
Avg MaxDD % |
| Information Technology |
6.12 |
5.30 |
75 |
51.02 |
-11.13 |
| Energy |
-2.06 |
-3.45 |
21 |
30.65 |
-9.52 |
| Health Care |
-2.08 |
-3.60 |
60 |
27.43 |
-8.72 |
| Communication Services |
-4.77 |
-7.12 |
22 |
33.33 |
-10.03 |
| Industrials |
-5.15 |
-6.04 |
83 |
27.28 |
-9.57 |
| Materials |
-6.13 |
-6.19 |
24 |
27.64 |
-10.27 |
| Financials |
-7.02 |
-6.95 |
75 |
25.47 |
-9.62 |
| Utilities |
-7.39 |
-6.59 |
31 |
20.68 |
-9.12 |
| Consumer Staples |
-7.55 |
-7.15 |
33 |
24.31 |
-9.74 |
| Real Estate |
-7.76 |
-7.26 |
30 |
19.21 |
-8.57 |
| Consumer Discretionary |
-9.50 |
-9.32 |
47 |
29.31 |
-12.05 |
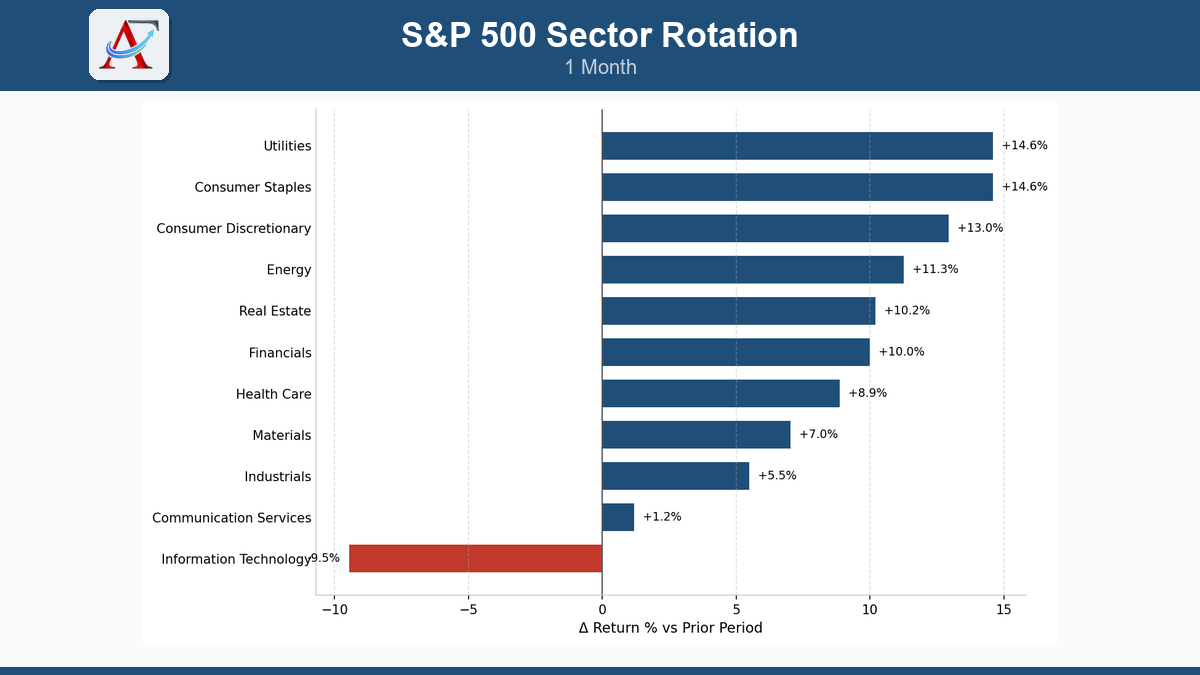
3. Sector Rotation (Current vs Prior)
| GICS Sector |
Current Avg Return % |
Prior Avg Return % |
Δ Return % |
# stocks |
| Utilities |
7.23 |
-7.39 |
14.62 |
31 |
| Consumer Staples |
7.06 |
-7.55 |
14.61 |
33 |
| Consumer Discretionary |
3.47 |
-9.50 |
12.97 |
47 |
| Energy |
9.22 |
-2.06 |
11.28 |
21 |
| Real Estate |
2.47 |
-7.76 |
10.23 |
30 |
| Financials |
2.99 |
-7.02 |
10.01 |
75 |
| Health Care |
6.82 |
-2.08 |
8.90 |
60 |
| Materials |
0.92 |
-6.13 |
7.05 |
24 |
| Industrials |
0.35 |
-5.15 |
5.50 |
83 |
| Communication Services |
-3.56 |
-4.77 |
1.21 |
22 |
| Information Technology |
-3.37 |
6.12 |
-9.49 |
75 |
4. Leaders – Top 5 Stocks by Sector
Communication Services
| Symbol |
Security |
Total Return % |
Max Drawdown % |
| OMC |
Omnicom Group |
9.52 |
-3.31 |
| NWSA |
News Corp (Class A) |
9.32 |
-1.99 |
| DIS |
Walt Disney Company (The) |
8.76 |
-4.54 |
| NWS |
News Corp (Class B) |
8.17 |
-2.45 |
| FOX |
Fox Corporation (Class B) |
4.39 |
-3.99 |
Consumer Discretionary
| Symbol |
Security |
Total Return % |
Max Drawdown % |
| HAS |
Hasbro |
35.74 |
-1.98 |
| RCL |
Royal Caribbean Group |
20.05 |
-5.01 |
| CCL |
Carnival Corporation |
19.77 |
-4.36 |
| ABNB |
Airbnb |
15.00 |
-2.79 |
| ULTA |
Ulta Beauty |
14.83 |
-2.89 |
Consumer Staples
| Symbol |
Security |
Total Return % |
Max Drawdown % |
| STZ |
Constellation Brands |
18.97 |
-1.26 |
| CASY |
Casey’s |
17.07 |
-2.02 |
| KR |
Kroger |
15.84 |
-3.92 |
| KMB |
Kimberly-Clark |
12.74 |
-4.70 |
| BF-B |
Brown–Forman |
11.87 |
-2.70 |
Energy
| Symbol |
Security |
Total Return % |
Max Drawdown % |
| APA |
APA Corporation |
19.37 |
-4.90 |
| COP |
ConocoPhillips |
17.73 |
-3.24 |
| MPC |
Marathon Petroleum |
17.72 |
-5.71 |
| EOG |
EOG Resources |
15.71 |
-3.57 |
| XOM |
ExxonMobil |
13.63 |
-1.32 |
Financials
| Symbol |
Security |
Total Return % |
Max Drawdown % |
| CBOE |
Cboe Global Markets |
26.61 |
-5.35 |
| FDS |
FactSet |
18.57 |
-4.80 |
| BRO |
Brown & Brown |
18.27 |
-3.01 |
| AJG |
Arthur J. Gallagher & Co. |
16.72 |
-2.46 |
| MRSH |
Marsh McLennan |
16.58 |
-1.22 |
Health Care
| Symbol |
Security |
Total Return % |
Max Drawdown % |
| CRL |
Charles River Laboratories |
24.53 |
-4.11 |
| VEEV |
Veeva Systems |
19.31 |
-4.25 |
| CI |
Cigna |
14.42 |
-2.83 |
| RMD |
ResMed |
13.75 |
-1.77 |
| MCK |
McKesson |
13.66 |
-2.85 |
Industrials
| Symbol |
Security |
Total Return % |
Max Drawdown % |
| EFX |
Equifax |
17.41 |
-7.77 |
| CTAS |
Cintas |
16.74 |
-3.77 |
| ALLE |
Allegion |
16.15 |
-4.84 |
| ADP |
Automatic Data Processing |
15.35 |
-2.38 |
| WM |
Waste Management |
15.15 |
-2.91 |
Information Technology
| Symbol |
Security |
Total Return % |
Max Drawdown % |
| PTC |
PTC Inc. |
38.03 |
-1.67 |
| ACN |
Accenture |
36.97 |
-8.90 |
| IT |
Gartner |
28.99 |
-4.15 |
| INTU |
Intuit |
20.29 |
-3.28 |
| ROP |
Roper Technologies |
19.89 |
-4.01 |
Materials
| Symbol |
Security |
Total Return % |
Max Drawdown % |
| DOW |
Dow Inc. |
13.82 |
-3.57 |
| LYB |
LyondellBasell |
10.81 |
-4.50 |
| BALL |
Ball Corporation |
10.10 |
-1.93 |
| IFF |
International Flavors & Fragrances |
9.85 |
-4.00 |
| LIN |
Linde plc |
8.33 |
-1.68 |
Real Estate
| Symbol |
Security |
Total Return % |
Max Drawdown % |
| CCI |
Crown Castle |
22.41 |
-4.39 |
| CSGP |
CoStar Group |
20.03 |
-4.32 |
| HST |
Host Hotels & Resorts |
12.61 |
-1.47 |
| AMT |
American Tower |
11.85 |
-4.12 |
| SBAC |
SBA Communications |
8.34 |
-7.30 |
Utilities
| Symbol |
Security |
Total Return % |
Max Drawdown % |
| PNW |
Pinnacle West Capital |
15.02 |
-2.18 |
| ED |
Consolidated Edison |
12.80 |
-2.29 |
| SO |
Southern Company |
11.29 |
-2.09 |
| CNP |
CenterPoint Energy |
10.52 |
-2.44 |
| XEL |
Xcel Energy |
10.46 |
-1.53 |
5. Laggards – Bottom 5 Stocks by Sector
Communication Services
| Symbol |
Security |
Total Return % |
Max Drawdown % |
| SKYD |
Skydance Corporation |
-21.99 |
-34.17 |
| APP |
AppLovin |
-17.45 |
-16.71 |
| T |
AT&T |
-16.34 |
-16.83 |
| META |
Meta Platforms |
-13.64 |
-17.36 |
| TMUS |
T-Mobile US |
-11.54 |
-14.46 |
Consumer Discretionary
| Symbol |
Security |
Total Return % |
Max Drawdown % |
| MGM |
MGM Resorts |
-25.87 |
-16.71 |
| CMG |
Chipotle Mexican Grill |
-15.87 |
-15.79 |
| WYNN |
Wynn Resorts |
-10.71 |
-10.34 |
| F |
Ford Motor Company |
-10.36 |
-8.73 |
| CVNA |
Carvana |
-9.60 |
-11.14 |
Consumer Staples
| Symbol |
Security |
Total Return % |
Max Drawdown % |
| BG |
Bunge Global |
-7.41 |
-7.24 |
| ADM |
Archer Daniels Midland |
-2.45 |
-5.12 |
| TGT |
Target Corporation |
-2.24 |
-4.74 |
| GIS |
General Mills |
-2.17 |
-9.07 |
| MKC |
McCormick & Company |
-0.93 |
-8.91 |
Energy
| Symbol |
Security |
Total Return % |
Max Drawdown % |
| BKR |
Baker Hughes |
-3.74 |
-7.28 |
| TPL |
Texas Pacific Land Corporation |
0.75 |
-9.61 |
| WMB |
Williams Companies |
0.83 |
-7.17 |
| SLB |
Schlumberger |
2.29 |
-6.95 |
| HAL |
Halliburton |
5.79 |
-3.72 |
Financials
| Symbol |
Security |
Total Return % |
Max Drawdown % |
| HOOD |
Robinhood Markets |
-22.52 |
-21.31 |
| COIN |
Coinbase |
-17.00 |
-17.45 |
| IBKR |
Interactive Brokers |
-12.32 |
-11.37 |
| BAC |
Bank of America |
-9.71 |
-11.13 |
| MS |
Morgan Stanley |
-9.53 |
-9.09 |
Health Care
| Symbol |
Security |
Total Return % |
Max Drawdown % |
| DXCM |
Dexcom |
-11.16 |
-11.14 |
| INCY |
Incyte |
-7.16 |
-12.98 |
| SOLV |
Solventum |
-3.35 |
-5.01 |
| JNJ |
Johnson & Johnson |
-1.99 |
-8.58 |
| MRK |
Merck & Co. |
-1.90 |
-6.52 |
Industrials
| Symbol |
Security |
Total Return % |
Max Drawdown % |
| BE |
Bloom Energy |
-29.76 |
-34.65 |
| FIX |
Comfort Systems USA |
-28.60 |
-36.14 |
| VRT |
Vertiv |
-21.89 |
-23.38 |
| HWM |
Howmet Aerospace |
-18.74 |
-20.03 |
| ETN |
Eaton Corporation |
-16.56 |
-17.74 |
Information Technology
| Symbol |
Security |
Total Return % |
Max Drawdown % |
| SNDK |
Sandisk |
-31.85 |
-30.75 |
| FLEX |
Flex Ltd. |
-31.83 |
-36.93 |
| STX |
Seagate Technology |
-31.70 |
-33.32 |
| COHR |
Coherent Corp. |
-30.38 |
-38.58 |
| INTC |
Intel |
-29.07 |
-32.89 |
Materials
| Symbol |
Security |
Total Return % |
Max Drawdown % |
| MOS |
Mosaic Company (The) |
-26.80 |
-27.10 |
| ALB |
Albemarle Corporation |
-17.45 |
-15.67 |
| NEM |
Newmont |
-11.88 |
-10.34 |
| FCX |
Freeport-McMoRan |
-10.00 |
-12.16 |
| SW |
Smurfit Westrock |
-9.98 |
-12.20 |
Real Estate
| Symbol |
Security |
Total Return % |
Max Drawdown % |
| ARE |
Alexandria Real Estate Equities |
-15.80 |
-18.30 |
| CBRE |
CBRE Group |
-9.61 |
-9.69 |
| EQIX |
Equinix |
-7.96 |
-9.05 |
| WY |
Weyerhaeuser |
-7.94 |
-8.29 |
| PLD |
Prologis |
-5.61 |
-7.27 |
Utilities
| Symbol |
Security |
Total Return % |
Max Drawdown % |
| NRG |
NRG Energy |
-8.35 |
-15.01 |
| CEG |
Constellation Energy |
-3.95 |
-15.63 |
| AES |
AES Corporation |
1.28 |
-0.27 |
| VST |
Vistra Corp. |
1.59 |
-15.93 |
| PCG |
PG&E Corporation |
2.19 |
-5.25 |