

Fixed-income investing is often misunderstood as a simple, static strategy: you buy a bond, collect the interest, and wait for maturity. However, when interest rates shift, the bond market moves dynamically. If you only look at a bond’s yield, you are missing the hidden forces that drive its price.
Two fundamental risk-management metrics — DurationBond Duration: Estimates the percentage change in a bond’s price for every 1% shift in interest rates. For example, a bond with a 3-year duration will gain or lose roughly ±3% of its value if rates fall or rise by 1%. More and ConvexityBond Convexity: Measures the rate of change in a bond’s duration as yields move, acting as a secondary risk gauge that explains price movements that duration alone cannot predict. More — are essential to predict how a bond will react to changing economic tides.
Defining the Core Metrics
To manage a bond portfolio effectively, you must first separate a bond’s timeline from its actual price sensitivity.
Duration: The Timeline of Risk
DurationBond Duration: Estimates the percentage change in a bond’s price for every 1% shift in interest rates. For example, a bond with a 3-year duration will gain or lose roughly ±3% of its value if rates fall or rise by 1%. More measures a bond’s price sensitivity to changes in interest rates. A higher durationBond Duration: Estimates the percentage change in a bond’s price for every 1% shift in interest rates. For example, a bond with a 3-year duration will gain or lose roughly ±3% of its value if rates fall or rise by 1%. More means a bond’s price will react more strongly to changes in yields.
-
- Macaulay DurationBond Duration: Estimates the percentage change in a bond’s price for every 1% shift in interest rates. For example, a bond with a 3-year duration will gain or lose roughly ±3% of its value if rates fall or rise by 1%. More: Calculates the weighted average time it takes an investor to receive all cash flows from a bond.
- Modified DurationBond Duration: Estimates the percentage change in a bond’s price for every 1% shift in interest rates. For example, a bond with a 3-year duration will gain or lose roughly ±3% of its value if rates fall or rise by 1%. More: Adjusts Macaulay durationBond Duration: Estimates the percentage change in a bond’s price for every 1% shift in interest rates. For example, a bond with a 3-year duration will gain or lose roughly ±3% of its value if rates fall or rise by 1%. More to show the direct percentage change in a bond’s price for a given shift in yield.
Convexity: The Rate of Acceleration
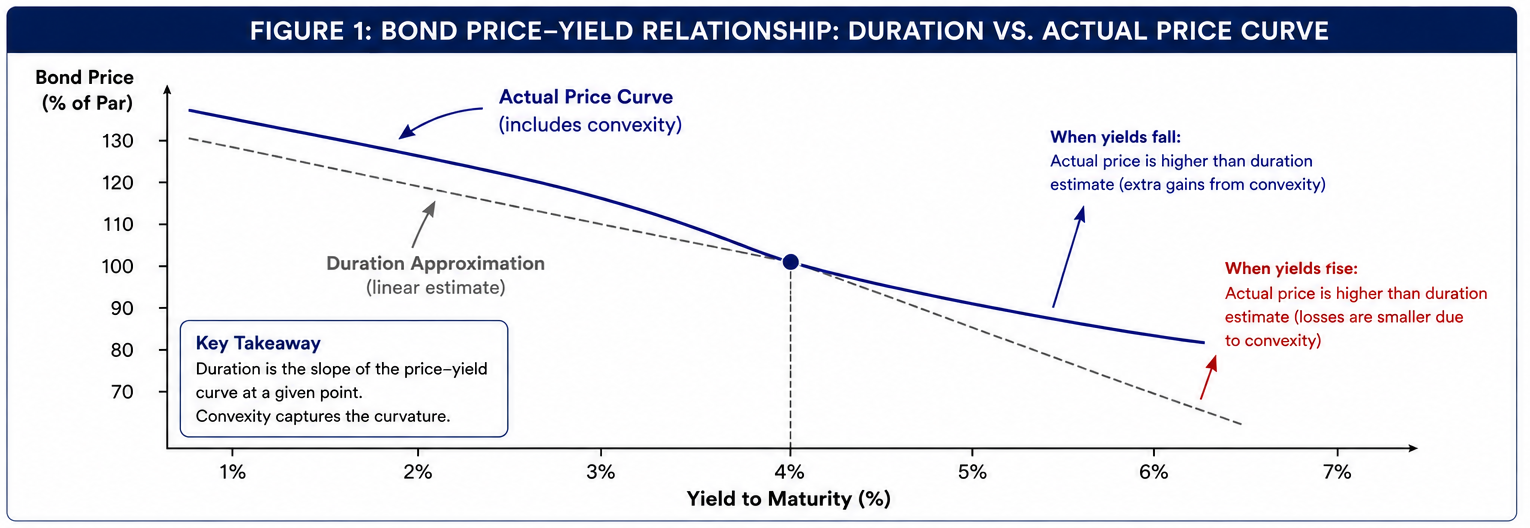
While durationBond Duration: Estimates the percentage change in a bond’s price for every 1% shift in interest rates. For example, a bond with a 3-year duration will gain or lose roughly ±3% of its value if rates fall or rise by 1%. More provides a straight-line estimate of price changes, the actual relationship between bond prices and interest rates is a curve. ConvexityBond Convexity: Measures the rate of change in a bond’s duration as yields move, acting as a secondary risk gauge that explains price movements that duration alone cannot predict. More measures the curvature of this relationship. The larger the interest-rate move, the more important convexityBond Convexity: Measures the rate of change in a bond’s duration as yields move, acting as a secondary risk gauge that explains price movements that duration alone cannot predict. More becomes in estimating actual portfolio performance. It shows how much a bond’s durationBond Duration: Estimates the percentage change in a bond’s price for every 1% shift in interest rates. For example, a bond with a 3-year duration will gain or lose roughly ±3% of its value if rates fall or rise by 1%. More changes as interest rates move. Think of durationBond Duration: Estimates the percentage change in a bond’s price for every 1% shift in interest rates. For example, a bond with a 3-year duration will gain or lose roughly ±3% of its value if rates fall or rise by 1%. More as the speed of a bond’s price movement, and convexityBond Convexity: Measures the rate of change in a bond’s duration as yields move, acting as a secondary risk gauge that explains price movements that duration alone cannot predict. More as its acceleration.
Formulas, Mechanics, and Real-Life Scenarios
Understanding the mathematical foundation of these metrics reveals how they function during real market shifts.
Calculating Duration
The formula for Modified DurationBond Duration: Estimates the percentage change in a bond’s price for every 1% shift in interest rates. For example, a bond with a 3-year duration will gain or lose roughly ±3% of its value if rates fall or rise by 1%. More bridges the gap between time and price volatility:
Where:
-
-
- YTM is the Yield to Maturity
- n is the number of coupon periods per year.
-
Real-Life Example
Imagine you hold a 10-year corporate bond with a Modified DurationBond Duration: Estimates the percentage change in a bond’s price for every 1% shift in interest rates. For example, a bond with a 3-year duration will gain or lose roughly ±3% of its value if rates fall or rise by 1%. More of 7.5 years.
-
-
- The Shock: The Central Bank aggressively raises its benchmark interest rate by 1.0% overnight to combat runaway inflation.
- The Impact: Your bond’s price will drop by approximately 7.5% (7.5 * -1%).
- The Reverse: If rates dropped by 1.0%, your bond’s price would rise by roughly 7.5%.
-
Calculating Convexity
Because bond price movements are non-linear, we use Taylor series expansion to calculate ConvexityBond Convexity: Measures the rate of change in a bond’s duration as yields move, acting as a secondary risk gauge that explains price movements that duration alone cannot predict. More (C). The approximation for a bond’s price change looks like this:
Where:
-
-
- Δy is the change in yield.
-
Real-Life Example
Consider two different 10-year bonds, both with a durationBond Duration: Estimates the percentage change in a bond’s price for every 1% shift in interest rates. For example, a bond with a 3-year duration will gain or lose roughly ±3% of its value if rates fall or rise by 1%. More of 7.5 years:
-
- Bond A is a conventional non-callable Treasury or corporate bond with positive convexityBond Convexity: Measures the rate of change in a bond’s duration as yields move, acting as a secondary risk gauge that explains price movements that duration alone cannot predict. More.
- Bond B is a callable bond or mortgage-backed security exhibiting negative convexityBond Convexity: Measures the rate of change in a bond’s duration as yields move, acting as a secondary risk gauge that explains price movements that duration alone cannot predict. More.
If interest rates plummet by 2%, Bond A’s low but positive convexityBond Convexity: Measures the rate of change in a bond’s duration as yields move, acting as a secondary risk gauge that explains price movements that duration alone cannot predict. More accelerates its price gains beyond the 15% predicted by durationBond Duration: Estimates the percentage change in a bond’s price for every 1% shift in interest rates. For example, a bond with a 3-year duration will gain or lose roughly ±3% of its value if rates fall or rise by 1%. More alone. Meanwhile, Bond B’s negative convexityBond Convexity: Measures the rate of change in a bond’s duration as yields move, acting as a secondary risk gauge that explains price movements that duration alone cannot predict. More halts its price growth because homeowners prepay their mortgages, cutting the investor’s high-yield cash flows short.
The Seesaw: Interest Rate Relationships
The relationship between interest rates, durationBond Duration: Estimates the percentage change in a bond’s price for every 1% shift in interest rates. For example, a bond with a 3-year duration will gain or lose roughly ±3% of its value if rates fall or rise by 1%. More, and convexityBond Convexity: Measures the rate of change in a bond’s duration as yields move, acting as a secondary risk gauge that explains price movements that duration alone cannot predict. More changes depending on whether the market is bullish or bearish.
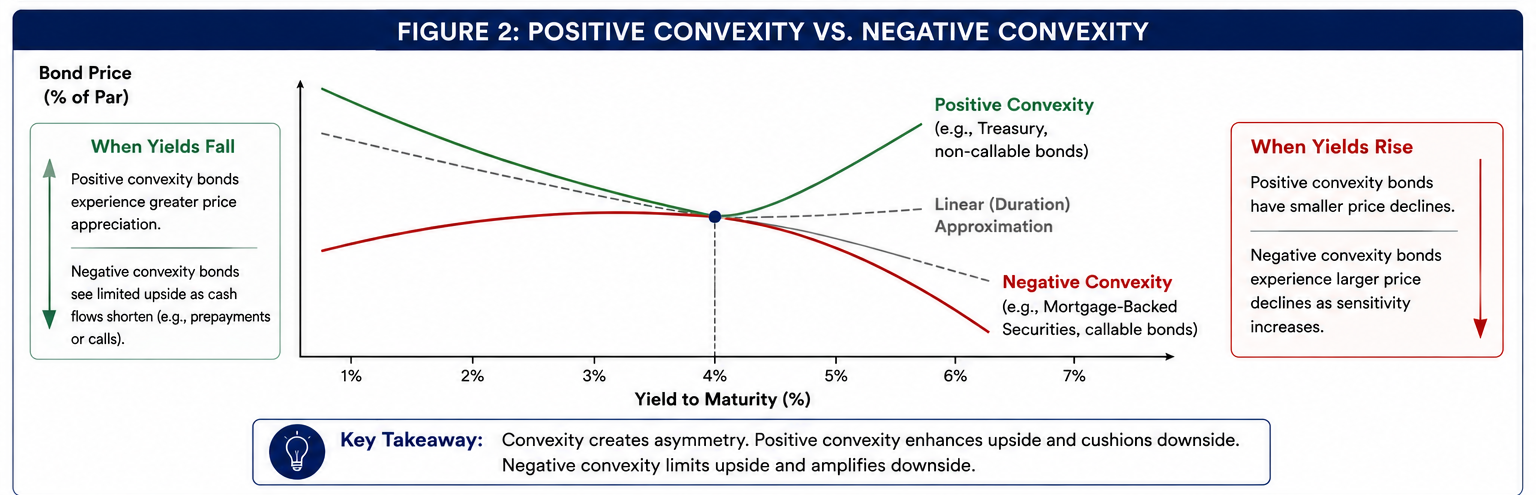
For bonds with positive convexityBond Convexity: Measures the rate of change in a bond’s duration as yields move, acting as a secondary risk gauge that explains price movements that duration alone cannot predict. More, gains from falling rates tend to exceed the losses from an equivalent rise in rates.
In a Rising Rate Environment
When central banks raise interest rates to combat inflation, bond prices generally decline. For bonds with positive convexityBond Convexity: Measures the rate of change in a bond’s duration as yields move, acting as a secondary risk gauge that explains price movements that duration alone cannot predict. More, the rate of price decline slows as yields continue to rise. In other words, losses accumulate more gradually than a simple durationBond Duration: Estimates the percentage change in a bond’s price for every 1% shift in interest rates. For example, a bond with a 3-year duration will gain or lose roughly ±3% of its value if rates fall or rise by 1%. More estimate would suggest because the bond becomes less sensitive to additional rate increases.
Bonds with negative convexityBond Convexity: Measures the rate of change in a bond’s duration as yields move, acting as a secondary risk gauge that explains price movements that duration alone cannot predict. More, however, behave differently. As yields rise, their price declines can exceed what durationBond Duration: Estimates the percentage change in a bond’s price for every 1% shift in interest rates. For example, a bond with a 3-year duration will gain or lose roughly ±3% of its value if rates fall or rise by 1%. More alone would predict. This occurs because the bond’s cash-flow characteristics become less favorable, causing interest-rate sensitivity to increase rather than decrease. Mortgage-backed securities and callable bonds often exhibit this behavior under certain market conditions.
In a Falling Rate Environment
When economic growth slows and interest rates decline, bond prices rise. For bonds with positive convexityBond Convexity: Measures the rate of change in a bond’s duration as yields move, acting as a secondary risk gauge that explains price movements that duration alone cannot predict. More, gains accelerate as yields fall. The bond becomes increasingly responsive to favorable rate movements, allowing investors to capture greater capital appreciation than durationBond Duration: Estimates the percentage change in a bond’s price for every 1% shift in interest rates. For example, a bond with a 3-year duration will gain or lose roughly ±3% of its value if rates fall or rise by 1%. More alone would imply.
Bonds with negative convexityBond Convexity: Measures the rate of change in a bond’s duration as yields move, acting as a secondary risk gauge that explains price movements that duration alone cannot predict. More experience the opposite effect. As yields fall, price appreciation begins to slow because borrowers are more likely to refinance or issuers are more likely to redeem callable debt. These actions shorten the expected life of the bond and limit upside potential. As a result, investors receive less benefit from declining interest rates than they would with a comparable positively convex bond.
This asymmetry is one reason why positive convexityBond Convexity: Measures the rate of change in a bond’s duration as yields move, acting as a secondary risk gauge that explains price movements that duration alone cannot predict. More is considered a valuable characteristic in fixed-income portfolios: it enhances upside participation during falling-rate environments while moderating downside exposure when rates rise.
How Institutional Bond Managers Play the Curve
Professional portfolio managers do not just passive accept rate changes; they actively manipulate durationBond Duration: Estimates the percentage change in a bond’s price for every 1% shift in interest rates. For example, a bond with a 3-year duration will gain or lose roughly ±3% of its value if rates fall or rise by 1%. More and convexityBond Convexity: Measures the rate of change in a bond’s duration as yields move, acting as a secondary risk gauge that explains price movements that duration alone cannot predict. More to outperform the market.
-
- Immunization Strategies: Liability-driven managers (like pension funds) match the durationBond Duration: Estimates the percentage change in a bond’s price for every 1% shift in interest rates. For example, a bond with a 3-year duration will gain or lose roughly ±3% of its value if rates fall or rise by 1%. More of their bond portfolios exactly to the durationBond Duration: Estimates the percentage change in a bond’s price for every 1% shift in interest rates. For example, a bond with a 3-year duration will gain or lose roughly ±3% of its value if rates fall or rise by 1%. More of their future cash payouts. This insulates the fund from interest rate risk, ensuring they can meet their financial obligations regardless of market swings.
- Altering Portfolio ConvexityBond Convexity: Measures the rate of change in a bond’s duration as yields move, acting as a secondary risk gauge that explains price movements that duration alone cannot predict. More: If a manager expects high market volatility but is unsure of the direction, they will buy high-convexity bonds. They pay a premium for this structural advantage, seeking greater price appreciation if yields decline while limiting incremental downside if yields rise.
- Tactical DurationBond Duration: Estimates the percentage change in a bond’s price for every 1% shift in interest rates. For example, a bond with a 3-year duration will gain or lose roughly ±3% of its value if rates fall or rise by 1%. More Shifts: When managers foresee a rate cut, they aggressively extend their portfolio durationBond Duration: Estimates the percentage change in a bond’s price for every 1% shift in interest rates. For example, a bond with a 3-year duration will gain or lose roughly ±3% of its value if rates fall or rise by 1%. More by buying long-term zero-coupon bonds to capture maximum price appreciation. If they expect hikes, they shorten durationBond Duration: Estimates the percentage change in a bond’s price for every 1% shift in interest rates. For example, a bond with a 3-year duration will gain or lose roughly ±3% of its value if rates fall or rise by 1%. More by moving into floating-rate notes or short-term Treasury bills.
For bonds containing embedded options, such as callable bonds or mortgage-backed securities, managers often use Effective DurationBond Duration: Estimates the percentage change in a bond’s price for every 1% shift in interest rates. For example, a bond with a 3-year duration will gain or lose roughly ±3% of its value if rates fall or rise by 1%. More. Unlike Modified DurationBond Duration: Estimates the percentage change in a bond’s price for every 1% shift in interest rates. For example, a bond with a 3-year duration will gain or lose roughly ±3% of its value if rates fall or rise by 1%. More, Effective DurationBond Duration: Estimates the percentage change in a bond’s price for every 1% shift in interest rates. For example, a bond with a 3-year duration will gain or lose roughly ±3% of its value if rates fall or rise by 1%. More incorporates expected changes in cash flows as interest rates move.
Investor Guide: Choosing the Right Instruments
As an individual investor, you can use these metrics to select fixed-income instruments that align precisely with your financial goals and market outlook.
-
- Scenario A: You Expect Volatile, Falling Rates
-
- The Strategy: Maximize both durationBond Duration: Estimates the percentage change in a bond’s price for every 1% shift in interest rates. For example, a bond with a 3-year duration will gain or lose roughly ±3% of its value if rates fall or rise by 1%. More and positive convexityBond Convexity: Measures the rate of change in a bond’s duration as yields move, acting as a secondary risk gauge that explains price movements that duration alone cannot predict. More.
- Best Instruments: Long-term Zero-Coupon Treasury Bonds. Because zero-coupon bonds make no interim coupon payments, investors receive all cash flows at maturity. As a result, their durationBond Duration: Estimates the percentage change in a bond’s price for every 1% shift in interest rates. For example, a bond with a 3-year duration will gain or lose roughly ±3% of its value if rates fall or rise by 1%. More equals their maturity, making them the most interest-rate-sensitive bonds available.
-
- Scenario B: You Want Stable Income in a Rising Rate Environment
-
- The Strategy: Minimize durationBond Duration: Estimates the percentage change in a bond’s price for every 1% shift in interest rates. For example, a bond with a 3-year duration will gain or lose roughly ±3% of its value if rates fall or rise by 1%. More to protect your principal.
- Best Instruments: Short-durationBond Duration: Estimates the percentage change in a bond’s price for every 1% shift in interest rates. For example, a bond with a 3-year duration will gain or lose roughly ±3% of its value if rates fall or rise by 1%. More High-Yield Corporate Bonds or Floating-Rate Notes (FRNs). FRNs reset their coupon payments with market rates, keeping their durationBond Duration: Estimates the percentage change in a bond’s price for every 1% shift in interest rates. For example, a bond with a 3-year duration will gain or lose roughly ±3% of its value if rates fall or rise by 1%. More near zero and preventing capital losses.
-
- Scenario C: You Seek Steady Yield and Predictable Cash Flow
-
- The Strategy: Balance yield against durationBond Duration: Estimates the percentage change in a bond’s price for every 1% shift in interest rates. For example, a bond with a 3-year duration will gain or lose roughly ±3% of its value if rates fall or rise by 1%. More expansion risk.
- Best Instruments: Standard Investment-Grade Municipal or Corporate Bonds with intermediate maturities (3 to 7 years). These offer a middle ground, providing reliable income without exposing your portfolio to extreme price volatility.
-
- Scenario A: You Expect Volatile, Falling Rates
Duration and the Yield Curve
DurationBond Duration: Estimates the percentage change in a bond’s price for every 1% shift in interest rates. For example, a bond with a 3-year duration will gain or lose roughly ±3% of its value if rates fall or rise by 1%. More risk is ultimately a function of the yield curve. Long-durationBond Duration: Estimates the percentage change in a bond’s price for every 1% shift in interest rates. For example, a bond with a 3-year duration will gain or lose roughly ±3% of its value if rates fall or rise by 1%. More assets are most sensitive to changes in long-term interest rates, while short-durationBond Duration: Estimates the percentage change in a bond’s price for every 1% shift in interest rates. For example, a bond with a 3-year duration will gain or lose roughly ±3% of its value if rates fall or rise by 1%. More securities respond primarily to movements at the front end of the curve. During bull-flatteningA bull flattener is a yield curve shift where long-term bond yields fall faster than short-term yields, flattening the curve. It is "bullish" for bond prices—particularly long-duration bonds—and often signals investor fear of an economic slowdown, acting as a "flight to safety". More environments, long-durationBond Duration: Estimates the percentage change in a bond’s price for every 1% shift in interest rates. For example, a bond with a 3-year duration will gain or lose roughly ±3% of its value if rates fall or rise by 1%. More bonds often outperform as declining long-end yields generate outsized capital gains. Conversely, bear-steepeningA bear steepener occurs when long-term rates rise faster than short-term rates and is generally associated with rising inflationary expectations. More episodes can disproportionately hurt long-durationBond Duration: Estimates the percentage change in a bond’s price for every 1% shift in interest rates. For example, a bond with a 3-year duration will gain or lose roughly ±3% of its value if rates fall or rise by 1%. More portfolios as term premiums rise and investors demand greater compensation for holding longer maturities.
Understanding durationBond Duration: Estimates the percentage change in a bond’s price for every 1% shift in interest rates. For example, a bond with a 3-year duration will gain or lose roughly ±3% of its value if rates fall or rise by 1%. More therefore requires more than forecasting the direction of interest rates—it requires understanding which segment of the yield curve is likely to move and why.
Conclusion
Yield is only one dimension of fixed-income investing. DurationBond Duration: Estimates the percentage change in a bond’s price for every 1% shift in interest rates. For example, a bond with a 3-year duration will gain or lose roughly ±3% of its value if rates fall or rise by 1%. More quantifies a bond’s exposure to interest-rate risk, while convexityBond Convexity: Measures the rate of change in a bond’s duration as yields move, acting as a secondary risk gauge that explains price movements that duration alone cannot predict. More measures how that exposure evolves as rates change. Together, these metrics provide a more complete framework for evaluating risk, constructing portfolios, and positioning for changing monetary and economic conditions. Whether managing a pension fund, a bond ETF, or a personal portfolio, understanding durationBond Duration: Estimates the percentage change in a bond’s price for every 1% shift in interest rates. For example, a bond with a 3-year duration will gain or lose roughly ±3% of its value if rates fall or rise by 1%. More and convexityBond Convexity: Measures the rate of change in a bond’s duration as yields move, acting as a secondary risk gauge that explains price movements that duration alone cannot predict. More is essential for navigating today’s interest-rate environment.
