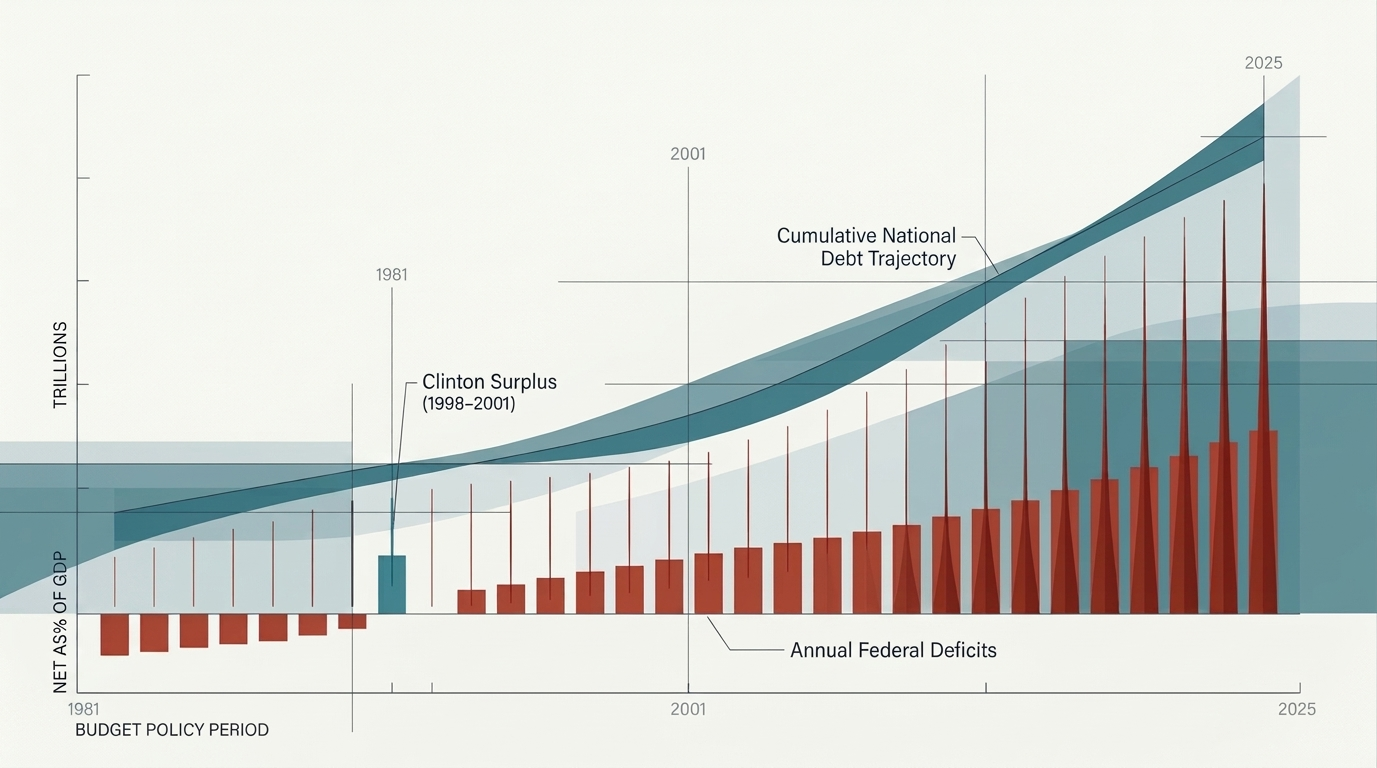
The Federal Budget Balance by Administration: 1981–2025
The unified federal budget has run a deficit in nearly every fiscal year since 1969. Absolute deficit levels have been large under both parties in recent decades, especially during recessions and the pandemic. From the start of the Reagan administration through the most recent completed fiscal years, every administration (Republican & Democrat) has overseen only deficits in the fiscal years primarily associated with it with one lone exception—President Bill Clinton.
Clinton remains the clear outlier.
Federal Budget Deficit
The federal budget deficit is the amount by which government spending exceeds revenues in a single fiscal year (October 1–September 30). It is an annual flow, not a stock. The national debt is the accumulated stock of past deficits (minus the rare surpluses), plus certain other financing items.
Deficits arise from two broad sources:
- Cyclical factors: During recessions, tax receipts fall automatically as incomes and profits decline, while certain outlays (unemployment insurance, SNAP) rise. These automatic stabilizers widen the deficit without any new legislation.
- Structural factors: Policy choices that leave spending persistently above revenues even at full employment—primarily mandatory programs (Social Security, Medicare, Medicaid), interest on the debt, and discretionary spending net of tax policy.
A surplus occurs when revenues exceed spending in a given year. The only sustained federal surpluses since 1969 were recorded in FY 1998–2001. In all other years over that span, the government has run a deficit and therefore added to the national debt. Interest on the growing debt stock then becomes a larger share of subsequent budgets, creating a feedback loop between annual deficits and the cumulative debt.
This distinction between the annual deficit and the accumulated debt is essential for interpreting both year-to-year budget results and longer-term debt-to-GDP trends.
The Federal Budget Balance by Administration: 1981–2025
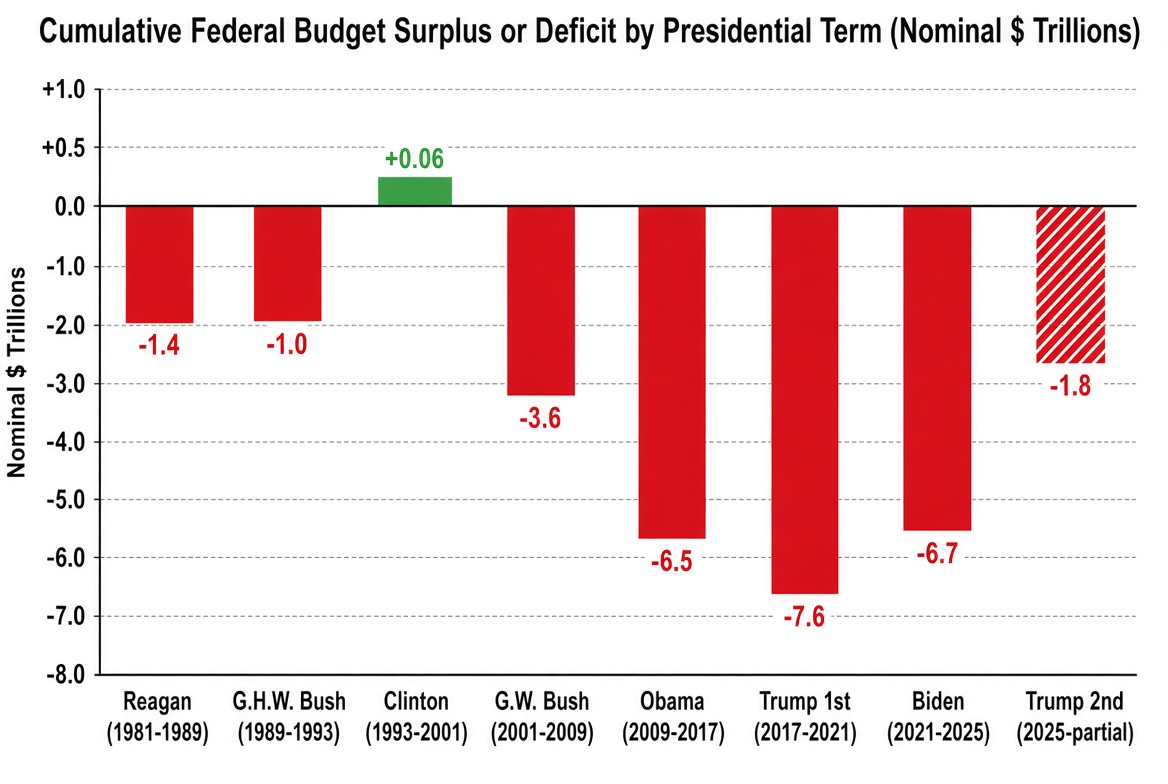
| Administration | Term | Deficit | Deficit as % of GDP | Net Interest (% of GDP) |
|---|---|---|---|---|
| Ronald Reagan | 8 years | –$1.4 trillion | –4.0% | 2.9% |
| George H.W. Bush | 4 years | –$1.0 trillion | –4.1% | 3.1% |
| Bill Clinton | 8 years | +$0.06 trillion (net surplus) | +0.1% | 2.6% |
| George W. Bush | 8 years | –$3.6 trillion | —3.4% | 1.5% |
| Barack Obama | 8 years | –$6.5 trillion | –4.8% | 1.4% |
| Donald Trump (1st term) | 4 years | –$7.6 trillion | –8.9% | 1.6% |
| Joe Biden | 4 years | –$6.7 trillion | –5.9% | 2.7% |
| Donald Trump (2nd term, partial) | ongoing | continuing deficit | –6.2% (FY2026) | 3.3% (FY2026) |
Cumulative net federal budget balances and net interest outlays by administration in nominal dollars and GDP-weighted shares. Fiscal years run October 1 through September 30, meaning figures span presidential transitions rather than exact calendar terms. Sources: OMB Historical Tables (1.1, 1.2, 3.1) and CBO historical budget data.
Context for the post-2008 period. The large deficits of FY 2009–2012 were driven primarily by the Great Recession: sharp declines in tax receipts and automatic increases in unemployment insurance, nutrition assistance, and related programs. Pre-existing policy (the 2001/2003 tax reductions and wartime spending) had already returned the budget to deficit before the crisis. Temporary measures such as TARP and the 2009 stimulus were secondary and time-limited; the deficit had already fallen substantially by FY 2013 as the economy recovered.
Structural observations. Debt-to-GDP declined for decades after World War II before rising under Reagan amid tax-rate reductions and higher defense outlays. It fell again under Clinton amid strong growth, higher revenues, and spending restraint, then rose under subsequent administrations. Long-term projections from CBO identify aging-related spending (Social Security and Medicare) and interest costs as the dominant structural drivers going forward, independent of short-term cyclical swings. The pattern of uninterrupted deficits under every Republican administration from Reagan onward, and the unique Clinton-era surpluses, is a documented feature of the official budget record.
The Zero-Rate Cushion (2002–2021). Net interest outlays remained historically low at 1.4% to 1.6% of GDP from the George W. Bush administration through Donald Trump’s first term despite rising debt, masked by near-zero interest rates and low Treasury yields.
The Refinancing Squeeze (2022–Present). Net interest costs climbed under Joe Biden (FY 2022–2025) to an average of 2.7% and reached 3.3% of GDP in FY 2026, eclipsing prior modern peaks as maturing low-rate debt rolled over at higher yields. Even without further Fed tightening, refinancing trillions in maturing Treasuries at prevailing market rates—alongside ongoing primary deficits—will continue to push debt-service costs higher.
Official OMB Historical Tables and CBO historical data remain the primary sources for these series.
Deficit Causes by Administration (Reagan–Present)
The annual federal deficit is shaped by a combination of inherited conditions, economic cycles, discretionary policy choices, and structural trends in mandatory spending and interest. No administration operates in isolation: presidents inherit prior budgets, share authority with Congress, and face external shocks. The following summarizes the primary drivers of the fiscal outcomes associated with each period, drawing on OMB historical data, CBO analyses, and contemporaneous economic conditions.
Ronald Reagan (1981–1989)
Deficits widened primarily because of large individual and corporate tax-rate reductions (the Economic Recovery Tax Act of 1981 and subsequent legislation) combined with a substantial increase in defense outlays. The 1981–82 recession further reduced revenues. Later in the term, some of the revenue loss was offset by base-broadening measures and a strong recovery, but the structural gap between lower revenues and higher defense spending persisted. The debt-to-GDP ratio rose markedly.
George H.W. Bush (1989–1993)
The deficit remained elevated due to the residual effects of prior tax cuts and defense spending, the costs of the 1990–91 recession, and higher interest payments on the growing debt stock. The 1990 budget agreement raised certain taxes (often cited as the reason Bush lost re-election) and imposed spending caps, moderating but not eliminating the deficit.
Bill Clinton (1993–2001)
The shift to surplus reflected three reinforcing factors: a prolonged economic expansion that produced strong revenue growth, tax increases enacted in 1993, and discretionary spending restraint (aided by a divided Congress after 1994). Capital-gains realizations and a temporary surge in individual income-tax receipts in the late 1990s further boosted revenues. The resulting four consecutive surpluses (FY 1998–2001) remain the only sustained surplus period since 1969.
George W. Bush (2001–2009)
Surpluses turned to deficits under the combined weight of the 2001 and 2003 tax reductions, increased defense and security spending after September 11 (including the wars in Afghanistan and Iraq), the 2001 recession, and the addition of the Medicare Part D prescription-drug benefit. The 2008 financial crisis and recession produced a sharp additional drop in revenues and a rise in automatic stabilizers; the TARP program and early stimulus measures added temporary costs. By the end of the term the deficit had reached levels not seen since the early 1980s as a share of GDP.
Barack Obama (2009–2017)
The large early-term deficits were driven overwhelmingly by the Great Recession: collapsing tax receipts and automatic increases in unemployment insurance, Medicaid, and related programs. The 2009 American Recovery and Reinvestment Act and residual costs of TARP contributed, but CBO and other analyses show that the bulk of the FY 2009–2012 deterioration relative to pre-crisis baselines was cyclical. As the economy recovered, the deficit declined substantially through FY 2015 before rising modestly again. Structural pressures from aging-related programs continued in the background.
Donald Trump (first term, 2017–2021)
The deficit rose in the pre-pandemic years due to the 2017 Tax Cuts and Jobs Act (which reduced individual and corporate rates and expanded certain deductions) and higher defense and non-defense discretionary spending. The COVID-19 pandemic then produced the largest peacetime deficits on record: emergency legislation (CARES Act and subsequent relief packages) drove both sharp spending increases and revenue losses from economic shutdowns. Automatic stabilizers amplified the effect. The FY 2020 deficit reached approximately 15 percent of GDP.
Joe Biden (2021–2025)
Early deficits remained elevated because of the lingering effects of pandemic relief (including the American Rescue Plan) and the associated revenue shortfalls. As emergency programs expired and the economy recovered, the deficit declined from its peak but remained historically high (roughly 5–6 percent of GDP). Additional legislation on infrastructure, semiconductors, and energy, together with rising net interest costs on the larger debt stock, contributed to the continued structural gap. Demographic pressures on Social Security and Medicare continued to grow.
Donald Trump (second term, ongoing)
Deficits have remained large, consistent with the structural imbalance between mandatory spending plus interest and the tax base. Recent legislation extending or expanding prior tax reductions has reduced projected revenues relative to earlier baselines, while interest costs continue to rise with the debt stock and higher rates on refinanced debt. Cyclical conditions have been more stable than in the prior term, so the deficit is driven primarily by the ongoing structural gap rather than a major recession or emergency.
Cross-cutting observations
Across all administrations, the largest swings in the deficit have come from recessions and the associated automatic stabilizers, followed by major tax-policy changes and temporary emergency spending. Over the longer run, the dominant structural drivers identified by CBO are the aging of the population (raising Social Security and Medicare outlays) and the compounding cost of interest on a rising debt stock. Discretionary spending, including defense, has been a smaller share of the total budget for most of this period and has not been the primary source of the multi-decade rise in the debt-to-GDP ratio.Official sources for the underlying series are OMB Historical Tables and CBO’s annual and long-term budget outlooks.
Composition of the Federal Budget and the Sources of Debt Growth
In a typical recent fiscal year (FY 2025), the federal government collected approximately $5.2–5.3 trillion in revenue and spent approximately $7.0–7.1 trillion, producing a deficit of roughly $1.8 trillion. That annual shortfall is the primary mechanism by which the national debt increases.
Revenue
Nearly all revenue comes from taxes:
- Individual income taxes: ~50–52% (~$2.6–2.7 trillion)
- Payroll (Social Security and Medicare) taxes: ~33% (~$1.7 trillion)
- Corporate income taxes: ~8–9% (~$0.45 trillion)
- Excise taxes, customs duties, estate taxes, and miscellaneous receipts: ~7%
Spending
Outlays fall into three broad categories:
- Mandatory spending (~60–65% of the total, roughly $4.2–4.5 trillion): programs set by permanent law rather than annual appropriations. The largest are Social Security, Medicare, Medicaid, and other income-support programs. These grow automatically with demographics, health costs, and inflation.
- Discretionary spending (~25–27%, roughly $1.9 trillion): amounts Congress appropriates each year. Defense accounts for roughly half of this category (~$0.9 trillion); the remainder covers non-defense functions (education, transportation, science, administration, etc.).
- Net interest on the debt (~13–15%, roughly $0.9–1.0 trillion): the cost of servicing previously accumulated debt. This line has grown rapidly as the debt stock has risen and as older low-rate debt has been refinanced at higher rates.
How the debt grows
Because mandatory programs and net interest already absorb a large majority of federal revenue, the government has relatively limited fiscal flexibility before borrowing becomes necessary. When total federal outlays exceed receipts, the resulting shortfall must be financed through additional borrowing. The primary deficit represents the amount by which federal spending, excluding interest, exceeds government revenues. When the government runs a primary deficit, additional borrowing is generally required to finance that shortfall. Net interest adds to the overall borrowing requirement, while changes in Treasury cash balances and other financing adjustments can cause the annual increase in debt to differ from the reported budget deficit. Interest on that larger stock then raises subsequent deficits, creating a feedback loop. Over successive years, these annual deficits accumulate into the multi-trillion-dollar increase in gross federal debt observed since the early 2000s.
The structural imbalance—mandatory outlays and interest rising faster than the tax base—rather than any single discretionary program or temporary emergency is the main driver of the long-term upward trajectory of the debt.
Official sources for these figures are CBO’s annual budget and economic outlook and the Treasury’s Monthly Treasury Statement / Combined Statement.
National Debt
The national debt is the cumulative stock of federal borrowing that results when annual deficits are not offset by surpluses. Gross debt comprises two components: debt held by the public (Treasury securities sold to outside investors, including the Federal Reserve) and intragovernmental holdings (balances held in trust funds such as Social Security).
Because the United States has run deficits in most years since the 1970s, the debt stock has risen continuously. Relative to the size of the economy, debt-to-GDP and net interest outlays as a share of GDP are the most informative measures. The former fell during the late-1990s surplus years and has climbed sharply since 2001, while the latter has surged more recently due to a self-reinforcing feedback loop—where a larger debt load and higher interest rates drive up borrowing costs, which in turn widen future deficits.
Official series are published by the U.S. Department of the Treasury and the Office of Management and Budget.
US Gross National Debt vs. Nominal GDP (November 2026)
As of mid-November 2026, gross national debt stands at approximately $40.7 trillion, exceeding the size of the annual U.S. economy (nominal GDP of roughly $33.0 trillion) by a substantial margin. The more economically relevant measure—debt held by the public (the portion owed to outside investors rather than other government accounts)—has reached parity with GDP at roughly $32.9 trillion, or ~100 percent of GDP, marking the highest sustained level since the immediate aftermath of World War II. This ratio has risen steadily for most of the past two decades, driven by primary deficits (spending above revenues excluding interest), the automatic effects of recessions and the pandemic, and rising interest costs on a larger stock of debt.
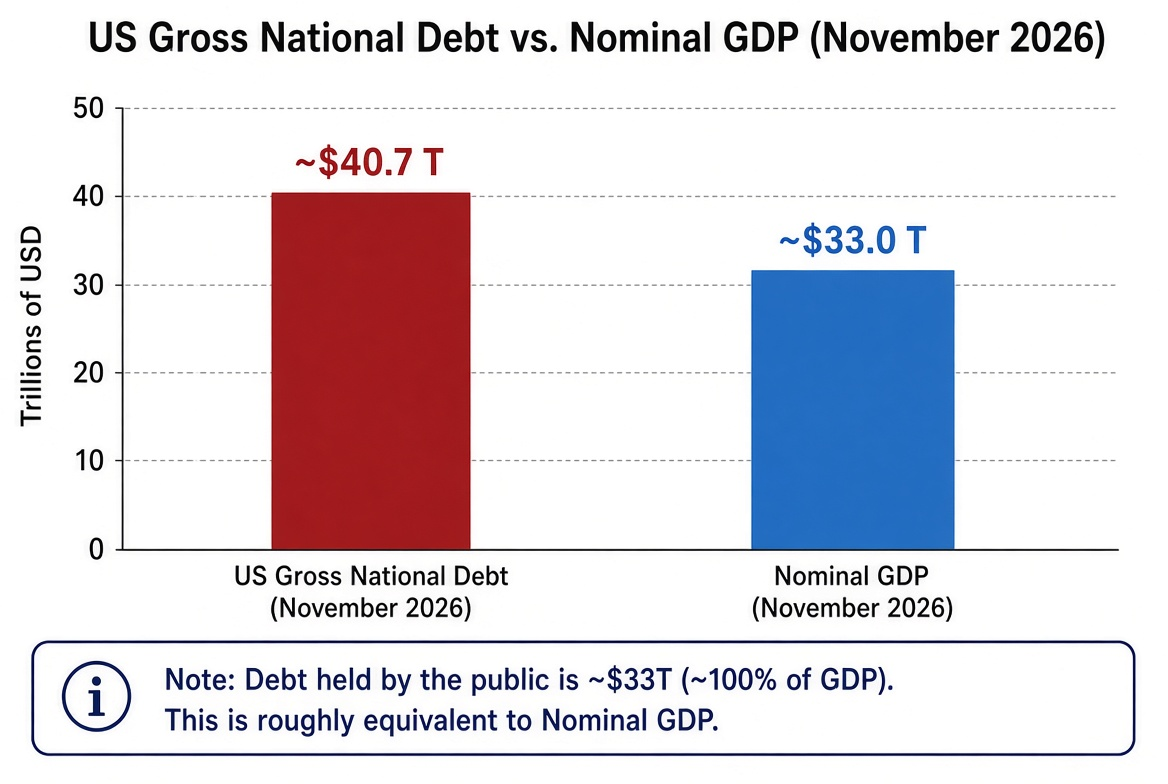
CBO and other official projections show the ratio continuing to climb under current law, primarily because of aging-related outlays for Social Security and Medicare plus net interest. While the United States retains substantial borrowing capacity due to the dollar’s reserve-currency status and deep capital markets, a debt-to-GDP ratio at or above 100 percent reduces fiscal space for future downturns or emergencies and increases the share of the budget absorbed by interest payments.
To see the immediate budget impact of this debt load, economists also track net interest outlays as a share of GDP—the annual cost of servicing debt held by the public relative to the size of the economy. For years, historically low interest rates cushioned the budget even as total debt climbed. As borrowing rates normalized on a much larger debt base, however, net interest costs surged past $1 trillion annually, reaching roughly 3.3 percent of GDP in fiscal year 2026 and eclipsing the previous modern peak set in 1991. Unlike spending on infrastructure, defense, or benefit programs, interest payments buy no new public goods; as this ratio climbs toward CBO’s projection of 4.6 percent of GDP over the next decade, debt service increasingly crowds out other priorities and consumes nearly one-fifth of all federal tax revenue.
Where the Remainder of the Debt Comes From
Gross national debt = debt held by the public + intragovernmental holdings.
- Debt held by the public (~$32.9 trillion as of mid-November 2026) is what the Treasury owes to outside holders: individual investors, mutual funds, pension funds, banks, the Federal Reserve, foreign governments, and others. This is the portion borrowed from the private and foreign sectors and is the measure economists typically use for debt-to-GDP ratios.
- Intragovernmental holdings (~$7.8 trillion) are Treasury securities held by other federal government accounts, primarily trust funds—most notably the Social Security trust funds (OASI and DI) and federal civilian and military retirement funds. When these programs collect more in payroll taxes or contributions than they pay out in a given period, the surplus is invested in special non-marketable Treasury securities by law.
These internal holdings are real liabilities of the Treasury and real assets of the trust funds, but they do not represent current borrowing from the public. While they net to zero for the government as a whole, they do not eliminate future benefit obligations (such as Social Security) or the need to finance them—and they are still counted in the official gross debt total and against the statutory debt limit.
In short, of the roughly $40.7 trillion gross debt, about $32.9 trillion is owed to external holders and about $7.8 trillion is owed to federal trust funds and accounts.