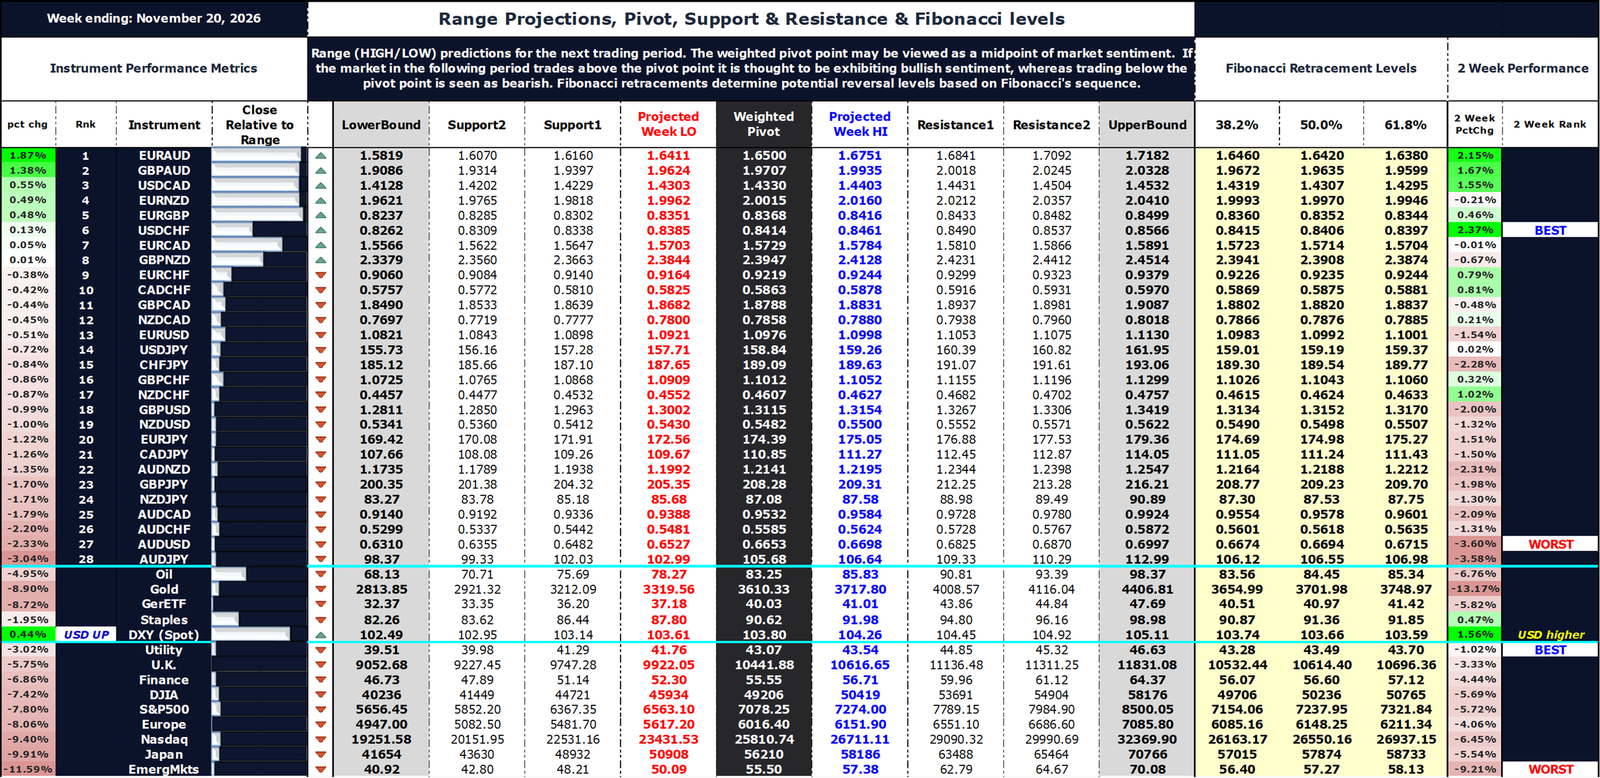
Market review and metrics for FX, Oil, Gold, Sectors & Global Indices. Pivot points, Support, Resistance & Fibonacci Reversal levels and Chart of Interest.
Global markets overview
Strongest to Weakest
| JPY | USD | CHF | EUR | CAD | GBP | NZD | AUD |
|---|
| Market | Best Performer | Worst Performer |
|---|---|---|
| FX | EURAUD | AUDJPY |
| Global Index / Sector | DXY (Spot) | Emerging Markets |
Commentary
FX
The Japanese yen (JPY) finished as the strongest major for the week ending November 20, 2026, while the Australian dollar (AUD) was the clear laggard. Relative performance across the 28 pairs showed JPY at the top of the strength ranking, followed by USD and CHF. AUD’s sharp underperformance (roughly –14% relative) stood out against a more mixed backdrop for the rest of the majors.
Pairs involving AUD on the short side dominated the top of the performance table (EURAUD +1.87%, GBPAUD +1.38%), while AUD crosses occupied most of the bottom ranks. The 2-week context reinforced the same directional bias for several of these pairs.
Analysis: JPY strength aligned with safe-haven demand amid a sharp risk-off move in equities. AUD weakness was more pronounced and consistent with the broader risk-off tone visible in global indices (especially Emerging Markets, Japan, and Nasdaq) and the sharp drops in oil and gold. USD and CHF held up reasonably well (second and third in the ranking)—further evidence that risk aversion was the predominant theme. The net result was a clean long-JPY / short-AUD bias that produced the week’s best and worst FX outcomes.
Global Indices
All major indices finished sharply lower. Emerging Market sector led the decline (–11.59%), followed by Nikkei (–9.91%) and Nasdaq (–9.40%). The S&P 500 closed the week down –7.80%. Defensive themes were limited; the relative performance bars showed broad weakness, with DXY the only modest positive among the tracked assets.
Analysis: The uniform underperformance across Japan, Europe, Nasdaq, and the S&P 500 pointed to a broad risk-off rotation rather than sector-specific issues. This occurred alongside sharp declines in oil and gold, consistent with markets reassessing growth, liquidity, and valuation concerns after the prior rebound. Emerging Markets finished at the bottom of the relative ranking.
Oil, Gold & Yields
| Instrument | Open | High | Low | Close | Return % |
|---|---|---|---|---|---|
| Oil | 87.76 | 88.23 | 80.67 | 83.42 | –4.95% |
| Gold | 3879.92 | 3901.1 | 3502.86 | 3534.5 | –8.90% |
| 10Yr Yield | 5.15% | 5.16% | 4.91% | 5.04% | -2.1% |
Crude oil (WTI) declined further. Gold posted a larger drop. The US 10-year yield eased on the week, closing near 5.04% (down from the prior Friday’s 5.15% close).
Analysis: The combination of weaker oil, sharply lower gold, and a modest decline in yields aligned with a risk-off tone across equities and parts of the FX complex. The drop in gold extended the multi-month decline from the January high, while the yield pullback provided limited relief. Oil’s further decline kept the commodity-currency picture negative.
Broader Market Interpretation
Taken together, the week’s price action reflected a sharp reversal into risk-off after the prior rebound. Equity indices sold off broadly (S&P 500 –7.80%, Nasdaq –9.40%, Japan –9.91%, Emerging Markets –11.59%), oil and gold declined further, and the 10-year yield eased from 5.15% to around 5.04%—insufficient to offset the equity and commodity weakness. DXY firmed modestly (+0.44%).
The combination of broad equity declines, commodity weakness, and relative strength in JPY/USD/CHF pointed to a reassessment of growth and risk appetite rather than a pure rate-driven move. AUDJPY’s –3.04% weekly drop and EURAUD’s outperformance captured the pro-cyclical underperformance. For FX markets, this environment was particularly unfavorable for commodity-linked and higher-beta currencies. The S&P 500’s breakdown from its early-October high, combined with already-wide constituent drawdowns, reinforced the lack of internal support.
FX Performance Composite
This chart provides the visual summary of relative FX strength, S&P 500 pivot/Fibonacci levels, and the relative performance of Oil, Gold, DXY, and major global indices/sectors.
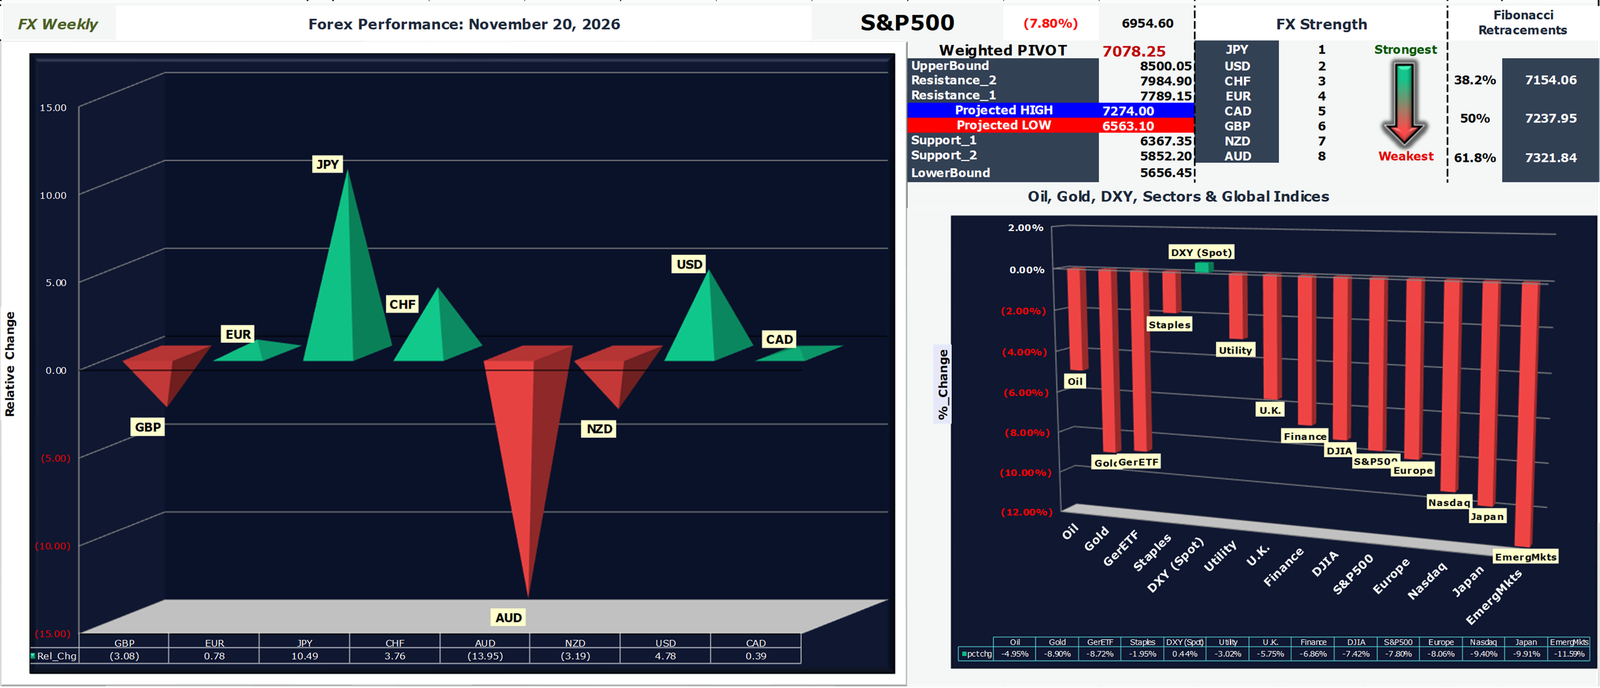
Chart of Interest: S&P500
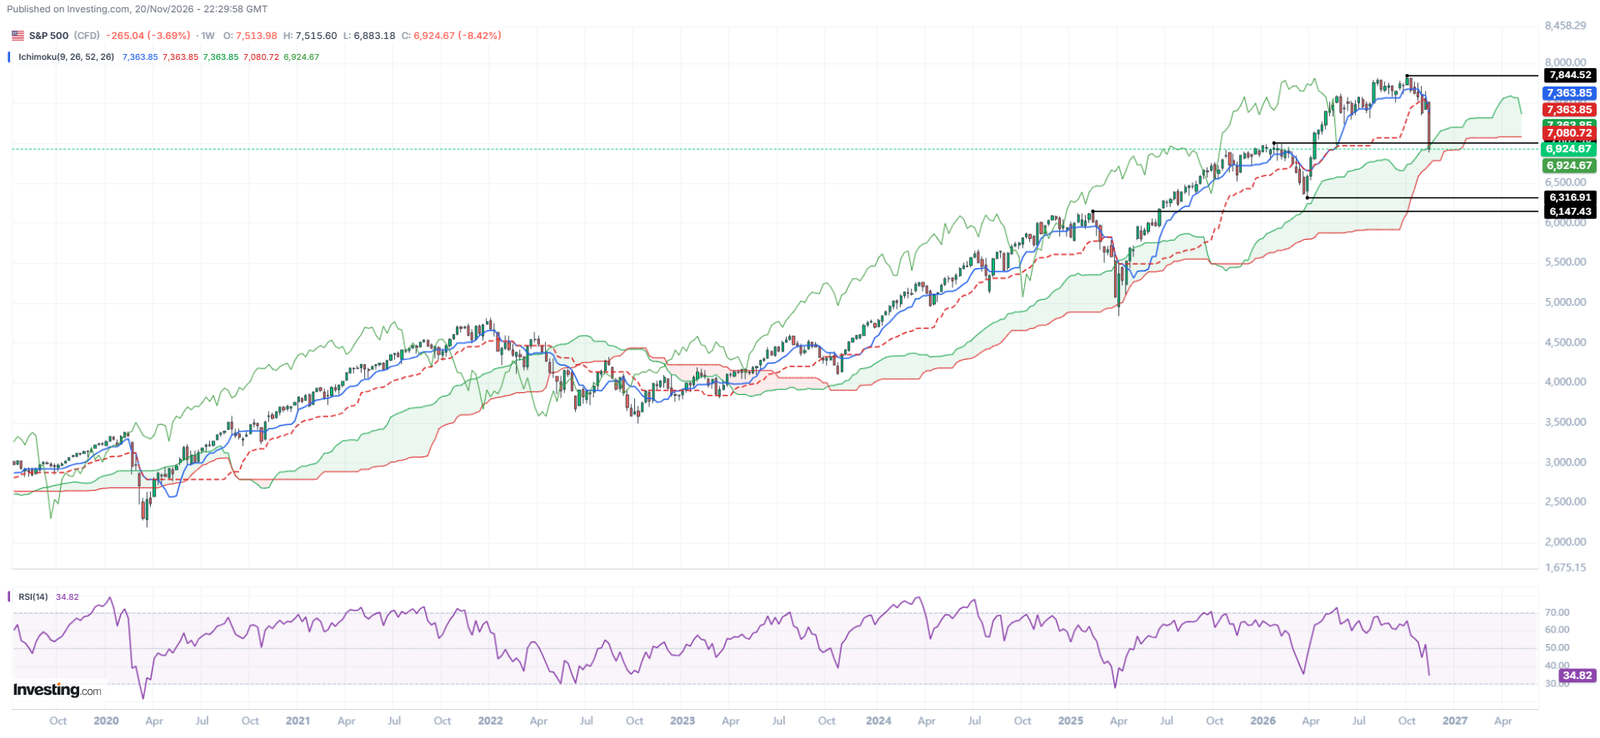
Chart notes:
The S&P 500 made its year-to-date high on 6 October 2026. By the week ending 20 November 2026 the index had closed near 6,955 (weekly open ~7,543, high ~7,593, low ~6,883, close ~6,955; –7.80% on the week). The pullback from the early-October peak has been accompanied by a broad deterioration in internal breadth.
S&P 500 Constituent Breadth and Leadership — Through 20 November 2026
Of the 503 constituents analyzed, 392 (77.9%) are already 10% or more below their all-time highs. 328 are 15% or more and 281 (55.9%) are 20% or more off. These are multi-year highs for many names, but the scale of the damage is still notable: more than half the index is already in a 20%+ drawdown from peak—the market threshold for a bear market.
Within the MAG 7 (AAPL, AMZN, MSFT, META, TSLA, GOOGL, NVDA) the picture is only marginally better. Six of the seven are 10% or more off their highs; the median drawdown across the group is 28.6%. The sole exception is Apple, which remains just 4.5% off its high and is the only MAG 7 name still meaningfully positive on a full-year basis (AMZN & MSFT are also up but less than 10%).
Contribution measured through the 6 October peak shows that the advance was not carried solely by the traditional MAG 7. Micron and AMD ranked first and second by approximate contribution (YTD return × weight) as of the peak date, ahead of Apple and Nvidia. Other semiconductor and memory names (SanDisk, Intel) also ranked inside the top ten at the peak, as did several non-MAG 7 growth names (Palo Alto Networks, CrowdStrike, Moderna). Nvidia itself was a significant positive contributor into the peak (+27% YTD as of 6 October), but has since given back the entire move and more (now –31% YTD and 46% off its high). Meta, Tesla, Alphabet, and Nvidia all rank near the bottom of the contribution list on a full-year basis.
On a full-year basis the contribution ranking has rotated. Apple remains the single largest positive contributor, helped by both its weight and the fact that it has continued higher since the index peak. Behind it the list is dominated by names outside the MAG 7: AMD, Micron, Moderna, Eli Lilly, Palo Alto Networks, CrowdStrike, Exxon, and Johnson & Johnson. Amazon is the only other MAG 7 name still inside the top ten.
The contribution figures are approximate (simple return × current SPY weight) and are intended to illustrate relative leadership rather than precise index-point attribution. Moderna’s extreme YTD return (+528%) is measured from a deeply depressed base; its all-time high remains the 2021 level, so its drawdown from true ATH is still large even after this year’s rally. A small number of defensive or idiosyncratic names (Costco, Coca-Cola, AbbVie, Berkshire) have held up well and made only modest contributions, underscoring that the damage has been concentrated in the higher-beta and prior-leadership cohorts.
While the financial press has largely credited the “MAG 7” for carrying the market into its October high, the underlying data tells a much more nuanced story; semiconductor and memory names were material contributors alongside (and in some cases ahead of) the largest technology platforms. Since the peak, the retreat has been broad. Six of the seven MAG 7 names are now in double-digit drawdowns, more than three-quarters of the index is 10% or more off its highs, and over half the constituents are already 20% off.
Apple is the clear exception inside the MAG 7. Insulated by $136 billion in annual free cash flow and minimal AI capital expenditures, Apple has acted as a defensive safe haven—remaining within 5% of its record high and single-handedly cushioning the index’s drop. The combination of prior leadership rolling over and already-wide breadth suggests limited internal support for the S&P 500 should the decline extend further.
Key levels (weekly closing basis):
- Weighted Pivot: 7,078.25
- Projected Week HI: 7,274.00
- Projected Week LO: 6,563.10
- Fibonacci retracements: 7,154.06 (38.2%), 7,237.95 (50%), 7,321.84 (61.8%)
Absolute highs/lows of the multi-week move sit beyond these weekly closes (see Pivot Point chart below).
Pivot Points, Range Projections, Support & Resistance & Fibonacci Levels
Range (HIGH/LOW) predictions for the next trading period. The weighted pivot point serves as the midpoint of market sentiment. If the market in the subsequent period trades above the pivot point, it exhibits bullish sentiment, whereas trading below it indicates a bearish bias. Fibonacci retracements identify potential support, resistance, and reversal levels derived from mathematical ratios in the Fibonacci sequence.