Introduction
Every quarter, JPMorgan’s Hedged Equity Fund (JHEQX) rolls its options hedge on the S&P 500. Commonly referred to as the JPM Collar, this transaction is one of the largest recurring options trades in the market. While many investors view the collar as a simple “ceiling” on the market, its true significance lies elsewhere.
Because of its size, the trade creates substantial dealer hedging activity that can influence market liquidity, volatility, and price behavior as the S&P 500 moves through the quarter. Rather than focusing solely on the option structure itself, it is often more useful to understand how dealers hedge the position, since those hedging flows are what can ultimately influence the market.
Q3 2026 Collar Structure
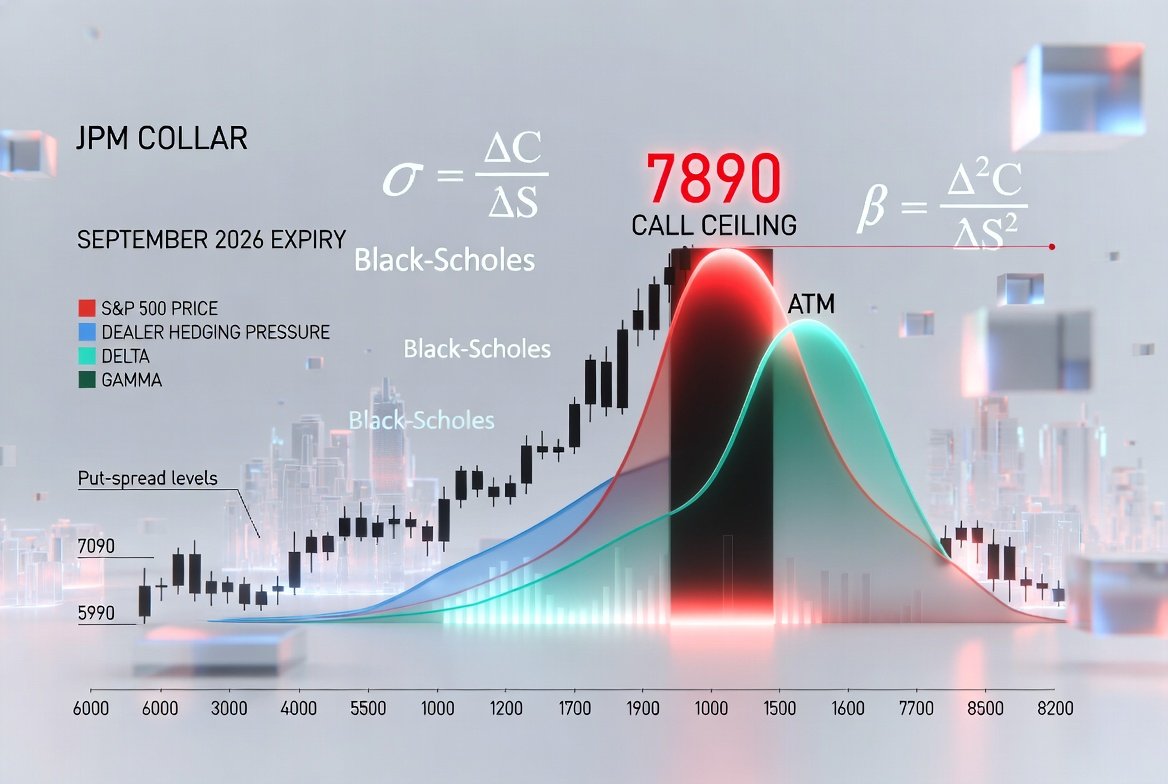
The Q3 2026 collar (rolled around June 30) consists of approximately 24,800 SPX option contracts per leg. With each SPX option controlling $100 times the index level, every leg represents roughly $15–20 billion of notional exposure at current market prices. Collectively, the structure represents tens of billions of dollars of option exposure that dealers must hedge throughout the quarter.
| Option Leg | Strike | Notional Value | JPM Position | Dealer Position | Primary Purpose |
|---|---|---|---|---|---|
| Upper Put | 7,090 | $ 17,583,200,000 | Long Put | Short Put | Downside protection begins |
| Lower Put | 5,990 | $ 14,855,200,000 | Short Put | Long Put | Finances the protective put |
| Call | 7,890 | $ 19,567,200,000 | Short Call | Long Call | Caps upside participation |
Although these strikes define the fund’s risk profile, they are more important because they determine where dealer hedging activity becomes most active. The collar matters not because JPMorgan intends to influence markets, but because its size creates systematic hedging flows large enough to affect index futures trading.
Dealer Hedging Mechanics
When JPM establishes the collar, dealers assume the opposite side of each option position. Dealers do not simply hold these options and wait for expiration. Instead, they continuously buy or sell S&P 500 futures to remain approximately deltaA measure of the change in an option's price for every $1 change in the underlying instrument. It also serves as a rough proxy for the probability that the option will expire in the money. More neutral.
The table below summarizes how dealer hedging typically evolves as the market moves.
| Market Movement | Dominant Option | Dealer Position | Typical Hedge Adjustment | Expected Market Impact |
|---|---|---|---|---|
| Rally toward 7,890 | Long Call | Increasing long deltaA measure of the change in an option's price for every $1 change in the underlying instrument. It also serves as a rough proxy for the probability that the option will expire in the money. More | Sell S&P futures | Resistance develops, volatility compresses |
| Rally well above 7,890 | Long Call (deep ITM) | DeltaA measure of the change in an option's price for every $1 change in the underlying instrument. It also serves as a rough proxy for the probability that the option will expire in the money. More stabilizes | Minimal additional selling | Easier upside trend |
| Decline toward 7,090 | Short Put | Increasing long deltaA measure of the change in an option's price for every $1 change in the underlying instrument. It also serves as a rough proxy for the probability that the option will expire in the money. More | Sell additional futures | Downside momentum can accelerate |
| Decline toward 5,990 | Put Spread | Long lower put offsets short upper put | Selling pressure begins fading | Stabilization increases |
| Well outside both strikes | Options deep ITM/OTM | DeltaA measure of the change in an option's price for every $1 change in the underlying instrument. It also serves as a rough proxy for the probability that the option will expire in the money. More largely stabilized | Very little rebalancing | Macro and fundamental flows dominate |
Dealer Regimes
The collar is better viewed as a series of dealer hedging regimes rather than fixed support or resistance levels.
| S&P 500 Location | Dealer Activity | Expected Market Behavior |
|---|---|---|
| Near 7,890 | Highest call gammaMeasures the rate of change in Delta. It shows how much the Delta will shift as the price of the underlying instrument moves, reflecting the stability of an option's price sensitivity. More | Frequent re-hedging, lower realized volatility, mean reversion |
| Between 7,090–7,890 | Moderate hedging | Limited mechanical influence |
| Near 7,090 | Highest put gammaMeasures the rate of change in Delta. It shows how much the Delta will shift as the price of the underlying instrument moves, reflecting the stability of an option's price sensitivity. More | Increased futures selling into weakness, greater downside sensitivity |
| Near 5,990 | Put spread offsets itself | Dealer flows begin stabilizing |
| Well outside the collar | Low gammaMeasures the rate of change in Delta. It shows how much the Delta will shift as the price of the underlying instrument moves, reflecting the stability of an option's price sensitivity. More | Dealer influence fades, macro drivers dominate |
Practical Interpretation
For traders and investors, the collar is most useful as a framework for understanding how dealer positioning may influence market behavior rather than as a prediction of where the S&P 500 will trade.
Near 7,890
- Dealer hedging becomes increasingly active.
- Volatility often compresses.
- Breakouts frequently encounter resistance.
Between the Strikes
- Dealer hedging remains relatively balanced.
- Broader macroeconomic and fundamental factors dominate day-to-day price action.
Near 7,090
- Dealer futures selling can reinforce downside momentum.
- Volatility may increase as the upper put becomes more sensitive to further declines.
Near 5,990
- The lower long put increasingly offsets the upper short put.
- Dealer hedging pressure gradually diminishes.
Well Outside the Collar
Once prices move well beyond the major strikes, option deltas become largely saturated and gammaMeasures the rate of change in Delta. It shows how much the Delta will shift as the price of the underlying instrument moves, reflecting the stability of an option's price sensitivity. More declines significantly. Dealer rebalancing slows, allowing macroeconomic developments, earnings, liquidity conditions, and investor positioning to become the primary drivers of market direction.
Bottom Line
The JPM collar is often described as a market “ceiling,” but that characterization oversimplifies its role. Its true importance lies in the mechanical hedging activity generated by dealers as they manage the substantial options exposure created by the trade. Those systematic futures transactions can suppress volatility near key strikes, reinforce mean-reverting price action, or amplify directional moves as the market transitions between different gammaMeasures the rate of change in Delta. It shows how much the Delta will shift as the price of the underlying instrument moves, reflecting the stability of an option's price sensitivity. More regimes.
Understanding these dealer hedging dynamics provides a more useful framework than viewing the collar as a static support or resistance level.