Period: October 2026
2-Year Yield: -0.27 bp
10-Year Yield: -0.31 bp
S&P 500: -0.9% (7,652 → 7,580)
1. Current Sector Performance
| GICS Sector |
Avg Return % |
Median Return % |
# stocks |
Avg Vol % |
Avg MaxDD % |
| Energy |
13.03 |
13.74 |
21 |
30.22 |
-5.11 |
| Consumer Staples |
10.19 |
10.79 |
33 |
27.92 |
-5.13 |
| Utilities |
10.12 |
10.93 |
31 |
22.69 |
-3.55 |
| Materials |
8.04 |
10.89 |
24 |
26.51 |
-5.20 |
| Consumer Discretionary |
7.40 |
8.47 |
47 |
33.65 |
-6.26 |
| Health Care |
7.39 |
7.32 |
60 |
31.72 |
-5.21 |
| Financials |
6.50 |
6.40 |
76 |
25.52 |
-5.17 |
| Real Estate |
5.57 |
3.93 |
30 |
29.00 |
-5.40 |
| Industrials |
4.89 |
6.34 |
83 |
34.13 |
-8.28 |
| Information Technology |
-3.74 |
-4.97 |
75 |
55.89 |
-17.39 |
| Communication Services |
-5.73 |
-0.58 |
22 |
42.94 |
-13.24 |
2. Prior Sector Performance
| GICS Sector |
Avg Return % |
Median Return % |
# stocks |
Avg Vol % |
Avg MaxDD % |
| Information Technology |
2.36 |
3.59 |
75 |
49.18 |
-11.15 |
| Health Care |
-1.05 |
-2.48 |
60 |
27.09 |
-8.06 |
| Industrials |
-4.91 |
-5.94 |
83 |
27.18 |
-8.51 |
| Communication Services |
-5.55 |
-5.97 |
22 |
32.78 |
-10.91 |
| Utilities |
-5.57 |
-5.83 |
31 |
18.50 |
-9.08 |
| Energy |
-6.40 |
-7.65 |
21 |
28.39 |
-11.34 |
| Consumer Staples |
-6.98 |
-6.02 |
33 |
23.46 |
-9.46 |
| Real Estate |
-7.16 |
-6.57 |
30 |
18.99 |
-8.43 |
| Consumer Discretionary |
-7.30 |
-7.92 |
47 |
29.94 |
-10.68 |
| Materials |
-7.86 |
-7.52 |
24 |
27.59 |
-9.99 |
| Financials |
-7.97 |
-7.74 |
76 |
25.35 |
-10.56 |
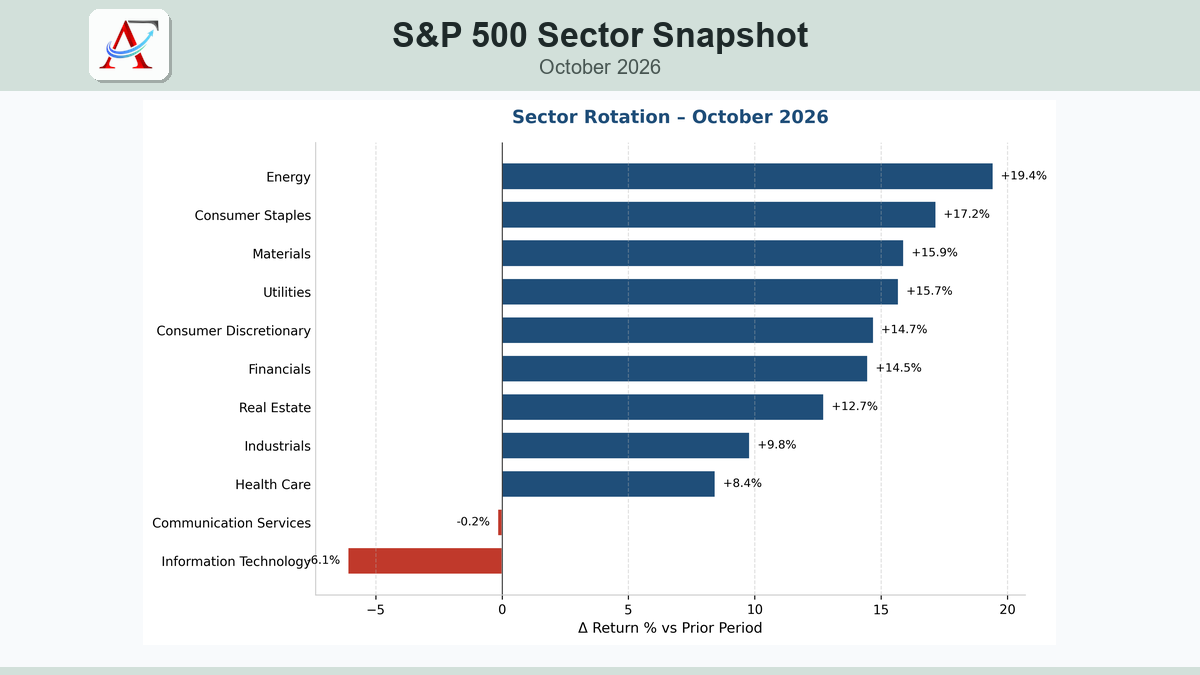
3. Sector Rotation (Current vs Prior)
| GICS Sector |
Current Avg Return % |
Prior Avg Return % |
Δ Return % |
# stocks |
| Energy |
13.03 |
-6.40 |
19.43 |
21 |
| Consumer Staples |
10.19 |
-6.98 |
17.17 |
33 |
| Materials |
8.04 |
-7.86 |
15.90 |
24 |
| Utilities |
10.12 |
-5.57 |
15.69 |
31 |
| Consumer Discretionary |
7.40 |
-7.30 |
14.70 |
47 |
| Financials |
6.50 |
-7.97 |
14.47 |
76 |
| Real Estate |
5.57 |
-7.16 |
12.73 |
30 |
| Industrials |
4.89 |
-4.91 |
9.80 |
83 |
| Health Care |
7.39 |
-1.05 |
8.44 |
60 |
| Communication Services |
-5.73 |
-5.55 |
-0.18 |
22 |
| Information Technology |
-3.74 |
2.36 |
-6.10 |
75 |
4. Leaders – Top 5 Stocks by Sector
Communication Services
| Symbol |
Security |
Total Return % |
Max Drawdown % |
| OMC |
Omnicom Group |
10.36 |
-5.94 |
| ECHO |
EchoStar |
8.42 |
-14.64 |
| CMCSA |
Comcast |
8.37 |
-5.56 |
| DIS |
Walt Disney Company (The) |
5.76 |
-3.62 |
| LYV |
Live Nation Entertainment |
5.07 |
-1.72 |
Consumer Discretionary
| Symbol |
Security |
Total Return % |
Max Drawdown % |
| HAS |
Hasbro |
35.82 |
-1.76 |
| NCLH |
Norwegian Cruise Line Holdings |
19.85 |
-4.50 |
| CCL |
Carnival Corporation |
17.48 |
-4.36 |
| ULTA |
Ulta Beauty |
17.26 |
-2.89 |
| HD |
Home Depot (The) |
15.72 |
-3.10 |
Consumer Staples
| Symbol |
Security |
Total Return % |
Max Drawdown % |
| STZ |
Constellation Brands |
20.65 |
-6.61 |
| WMT |
Walmart |
18.85 |
-1.94 |
| KDP |
Keurig Dr Pepper |
18.13 |
-1.90 |
| EL |
Estée Lauder Companies (The) |
17.74 |
-3.29 |
| DLTR |
Dollar Tree |
17.41 |
-5.64 |
Energy
| Symbol |
Security |
Total Return % |
Max Drawdown % |
| APA |
APA Corporation |
27.80 |
-2.14 |
| COP |
ConocoPhillips |
23.08 |
-2.25 |
| EOG |
EOG Resources |
20.97 |
-1.69 |
| TRGP |
Targa Resources |
17.00 |
-3.58 |
| OXY |
Occidental Petroleum |
15.69 |
-2.24 |
Financials
| Symbol |
Security |
Total Return % |
Max Drawdown % |
| FDS |
FactSet |
22.09 |
-7.72 |
| CBOE |
Cboe Global Markets |
21.88 |
-7.69 |
| AJG |
Arthur J. Gallagher & Co. |
21.02 |
-4.42 |
| ERIE |
Erie Indemnity |
20.07 |
-4.05 |
| GPN |
Global Payments |
18.57 |
-5.18 |
Health Care
| Symbol |
Security |
Total Return % |
Max Drawdown % |
| LLY |
Lilly (Eli) |
22.51 |
-2.54 |
| REGN |
Regeneron Pharmaceuticals |
22.37 |
-1.80 |
| CRL |
Charles River Laboratories |
21.83 |
-4.44 |
| LH |
Labcorp |
17.29 |
-2.19 |
| GEHC |
GE HealthCare |
17.20 |
-2.31 |
Industrials
| Symbol |
Security |
Total Return % |
Max Drawdown % |
| EFX |
Equifax |
34.51 |
-6.11 |
| PNR |
Pentair |
25.65 |
-1.73 |
| LMT |
Lockheed Martin |
25.08 |
-2.14 |
| ALLE |
Allegion |
21.25 |
-4.70 |
| MAS |
Masco |
19.64 |
-3.69 |
Information Technology
| Symbol |
Security |
Total Return % |
Max Drawdown % |
| ACN |
Accenture |
41.96 |
-9.11 |
| PTC |
PTC Inc. |
39.37 |
-1.67 |
| ROP |
Roper Technologies |
33.88 |
-2.03 |
| GEN |
Gen Digital |
32.29 |
-4.75 |
| INTU |
Intuit |
24.29 |
-7.53 |
Materials
| Symbol |
Security |
Total Return % |
Max Drawdown % |
| DOW |
Dow Inc. |
26.00 |
-2.60 |
| LYB |
LyondellBasell |
19.44 |
-3.06 |
| BALL |
Ball Corporation |
18.63 |
-3.87 |
| NUE |
Nucor |
17.16 |
-2.72 |
| VMC |
Vulcan Materials Company |
14.97 |
-2.85 |
Real Estate
| Symbol |
Security |
Total Return % |
Max Drawdown % |
| CCI |
Crown Castle |
33.07 |
-4.39 |
| SBAC |
SBA Communications |
16.88 |
-7.30 |
| EXR |
Extra Space Storage |
15.06 |
-1.64 |
| PSA |
Public Storage |
14.82 |
-1.35 |
| AMT |
American Tower |
14.72 |
-4.12 |
Utilities
| Symbol |
Security |
Total Return % |
Max Drawdown % |
| CNP |
CenterPoint Energy |
15.33 |
-2.44 |
| WEC |
WEC Energy Group |
15.17 |
-1.57 |
| NI |
NiSource |
15.05 |
-1.71 |
| EXC |
Exelon |
14.26 |
-2.51 |
| PNW |
Pinnacle West Capital |
14.23 |
-2.18 |
5. Laggards – Bottom 5 Stocks by Sector
Communication Services
| Symbol |
Security |
Total Return % |
Max Drawdown % |
| RDDT |
Reddit |
-35.60 |
-42.64 |
| SKYD |
Skydance |
-23.04 |
-30.47 |
| APP |
AppLovin |
-21.32 |
-18.96 |
| GOOGL |
Alphabet Inc. (Class A) |
-18.67 |
-20.90 |
| GOOG |
Alphabet Inc. (Class C) |
-18.35 |
-20.40 |
Consumer Discretionary
| Symbol |
Security |
Total Return % |
Max Drawdown % |
| BKNG |
Booking Holdings |
-9.07 |
-10.77 |
| WYNN |
Wynn Resorts |
-6.01 |
-7.84 |
| GRMN |
Garmin |
-4.94 |
-7.75 |
| GPC |
Genuine Parts Company |
-3.85 |
-9.75 |
| AMZN |
Amazon |
-3.53 |
-8.48 |
Consumer Staples
| Symbol |
Security |
Total Return % |
Max Drawdown % |
| BG |
Bunge Global |
-9.64 |
-11.84 |
| ADM |
Archer Daniels Midland |
-3.11 |
-8.90 |
| TGT |
Target Corporation |
-1.47 |
-6.39 |
| MKC |
McCormick & Company |
3.00 |
-5.44 |
| HSY |
Hershey Company (The) |
5.08 |
-8.75 |
Energy
| Symbol |
Security |
Total Return % |
Max Drawdown % |
| BKR |
Baker Hughes |
0.60 |
-7.61 |
| TPL |
Texas Pacific Land Corporation |
1.80 |
-11.15 |
| VLO |
Valero Energy |
3.11 |
-16.36 |
| EXE |
Expand Energy |
7.68 |
-4.42 |
| WMB |
Williams Companies |
9.39 |
-7.17 |
Financials
| Symbol |
Security |
Total Return % |
Max Drawdown % |
| HOOD |
Robinhood Markets |
-24.45 |
-25.52 |
| COIN |
Coinbase |
-23.00 |
-24.17 |
| IBKR |
Interactive Brokers |
-9.97 |
-15.10 |
| SCHW |
Charles Schwab Corporation |
-9.91 |
-10.49 |
| BAC |
Bank of America |
-8.12 |
-8.37 |
Health Care
| Symbol |
Security |
Total Return % |
Max Drawdown % |
| ILMN |
Illumina, Inc. |
-13.77 |
-19.65 |
| SOLV |
Solventum |
-7.74 |
-7.61 |
| DXCM |
Dexcom |
-4.64 |
-11.14 |
| BAX |
Baxter International |
-4.17 |
-10.71 |
| BSX |
Boston Scientific |
-3.83 |
-8.76 |
Industrials
| Symbol |
Security |
Total Return % |
Max Drawdown % |
| BE |
Bloom Energy |
-26.65 |
-34.65 |
| FIX |
Comfort Systems USA |
-25.48 |
-36.14 |
| CAT |
Caterpillar Inc. |
-23.01 |
-27.70 |
| CHRW |
C.H. Robinson |
-15.78 |
-20.99 |
| ETN |
Eaton Corporation |
-13.90 |
-17.74 |
Information Technology
| Symbol |
Security |
Total Return % |
Max Drawdown % |
| INTC |
Intel |
-45.30 |
-45.20 |
| SNDK |
Sandisk |
-33.85 |
-35.62 |
| TER |
Teradyne |
-31.56 |
-38.90 |
| STX |
Seagate Technology |
-30.11 |
-33.32 |
| TWLO |
Twilio |
-29.89 |
-31.94 |
Materials
| Symbol |
Security |
Total Return % |
Max Drawdown % |
| MOS |
Mosaic Company (The) |
-15.06 |
-19.86 |
| ALB |
Albemarle Corporation |
-13.97 |
-14.43 |
| FCX |
Freeport-McMoRan |
-10.56 |
-15.04 |
| NEM |
Newmont |
-7.57 |
-10.11 |
| SW |
Smurfit Westrock |
-2.29 |
-6.30 |
Real Estate
| Symbol |
Security |
Total Return % |
Max Drawdown % |
| ARE |
Alexandria Real Estate Equities |
-15.30 |
-15.75 |
| DOC |
Healthpeak Properties |
-4.19 |
-5.08 |
| ESS |
Essex Property Trust |
-1.93 |
-7.45 |
| PLD |
Prologis |
-1.43 |
-7.08 |
| VTR |
Ventas |
-0.26 |
-7.26 |
Utilities
| Symbol |
Security |
Total Return % |
Max Drawdown % |
| VST |
Vistra Corp. |
0.01 |
-17.00 |
| NRG |
NRG Energy |
0.43 |
-15.01 |
| AES |
AES Corporation |
0.71 |
-0.33 |
| CEG |
Constellation Energy |
3.29 |
-15.95 |
| ES |
Eversource Energy |
6.84 |
-3.55 |