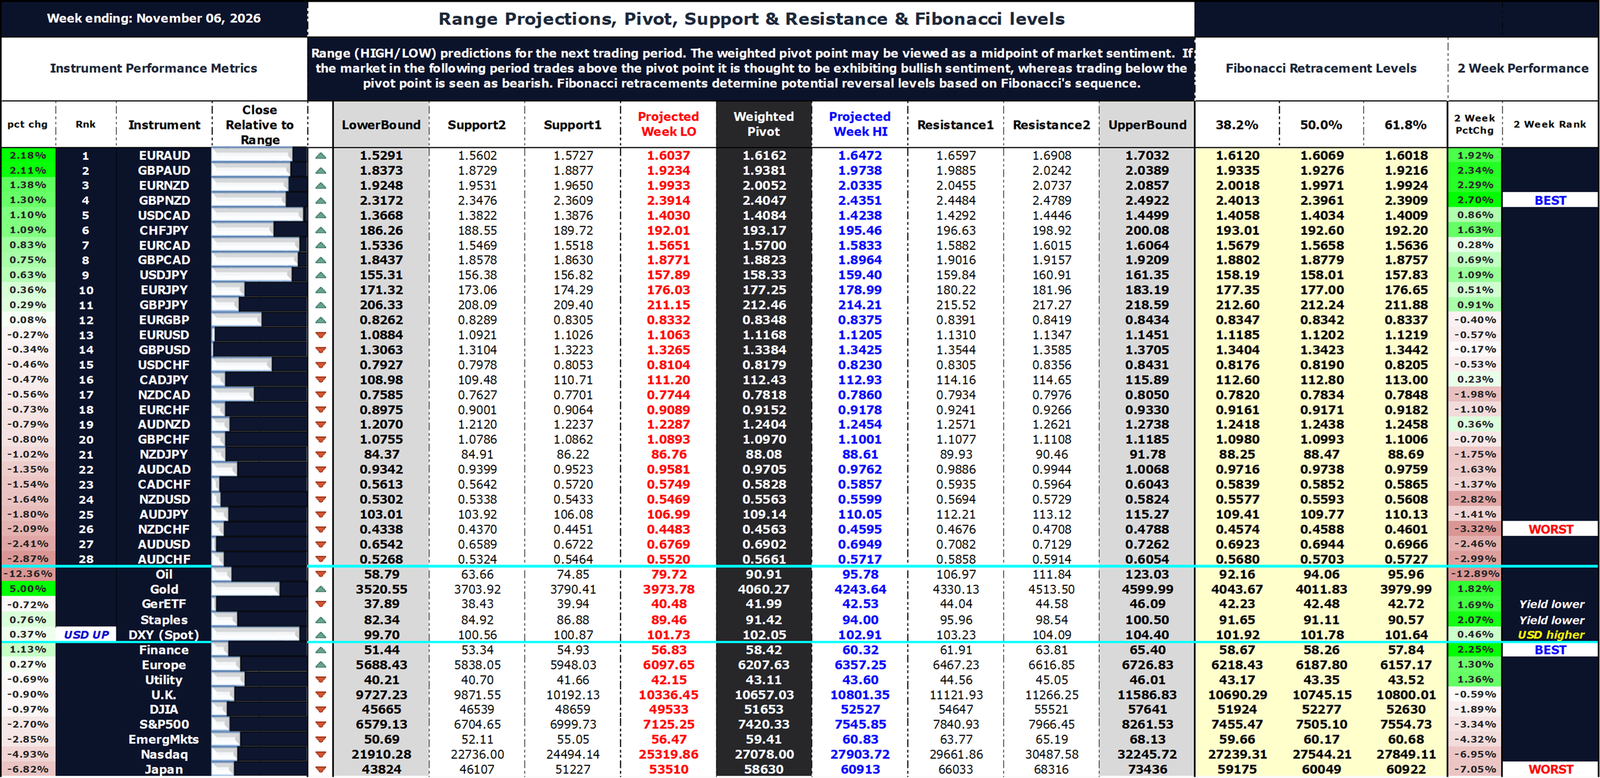
Market review and metrics for FX, Oil, Gold, Global Indices & Yields. Pivot points, Support, Resistance & Fibonacci Reversal levels and Chart of Interest.
Global markets overview
Strongest to Weakest
| CHF | USD | EUR | GBP | JPY | CAD | NZD | AUD |
|---|
| Market | Best Performer | Worst Performer |
|---|---|---|
| FX | EURAUD | AUDCHF |
| Global Index / Sector | Finance Sector | Japan |
Commentary
FX
The Swiss franc (CHF) finished as the strongest major for the week ending November 6, 2026, while the Australian dollar (AUD) was the clear laggard. Relative performance across the 28 pairs showed CHF at the top of the strength ranking, followed by USD and EUR. AUD’s sharp underperformance (roughly –13.5% relative) stood out against a more mixed backdrop for the rest of the majors.
Pairs involving AUD on the short side dominated the top of the performance table (EURAUD +2.18%, GBPAUD +2.11%, EURNZD +1.38%), while AUD crosses occupied most of the bottom ranks. The 2-week context reinforced the same directional bias for several of these pairs.
Analysis: CHF strength aligned with safe-haven demand and a firmer DXY. AUD weakness was more pronounced and consistent with the broader risk-off tone visible in equities (especially Nasdaq and Japan) and the sharp drop in oil. USD and EUR held up reasonably well (second and third in the ranking), while NZD also lagged. The net result was a clean long-CHF / short-AUD bias that produced the week’s best and worst FX outcomes.
Global Indices
Finance sector led the equity complex, while Japan and Nasdaq lagged sharply. The S&P 500 finished the week lower. Defensive/sector rotation themes were visible in the relative performance bars, with Finance positive while growth-heavy Nasdaq and Japan underperformed significantly.
Analysis: The leadership from Finance sector versus Nasdaq and Japan underperformance pointed to a rotation out of growth/tech/AI into more defensive areas. This occurred alongside the sharp oil decline and gold rebound, consistent with markets reassessing growth and liquidity expectations. Emerging Markets also finished near the bottom of the relative ranking.
Oil, Gold & Yields
Crude oil (WTI) posted a sharp decline (–12.36%). Gold rebounded strongly (+5.00%). US 10-year yields moved lower (DXY firmed modestly).
Analysis: The combination of weaker oil and a gold rebound aligned with a risk-off tone in parts of the FX complex (AUD weakness) and equities. CAD lagged modestly amid the oil drop, while CHF and USD strength suggested safe-haven and relative-rate support. Oil’s sharp decline kept the commodity-currency picture negative.
FX Performance Composite
This chart provides the visual summary of relative FX strength, S&P 500 pivot/Fibonacci levels, and the relative performance of Oil, Gold, DXY, and major global indices/sectors.
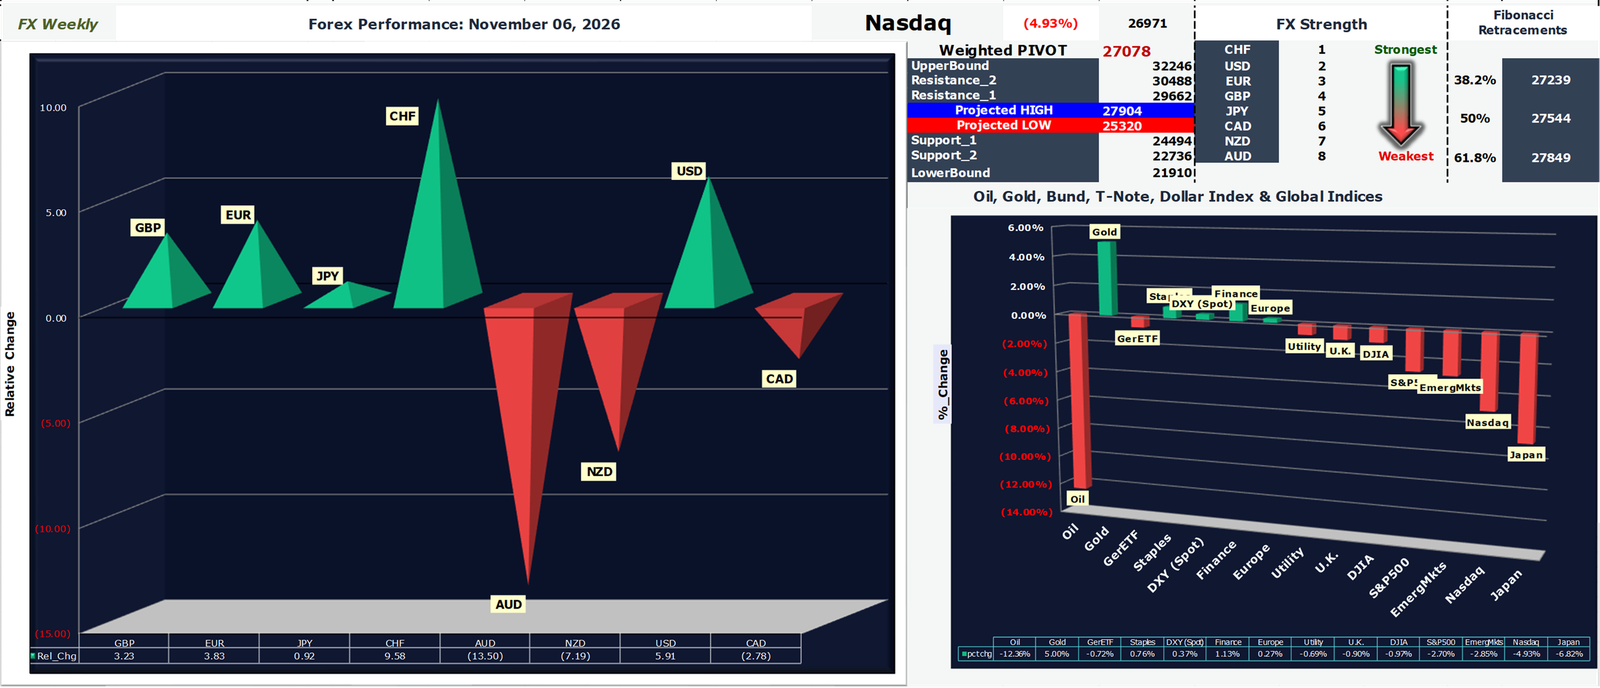
Chart of Interest – AUDJPY
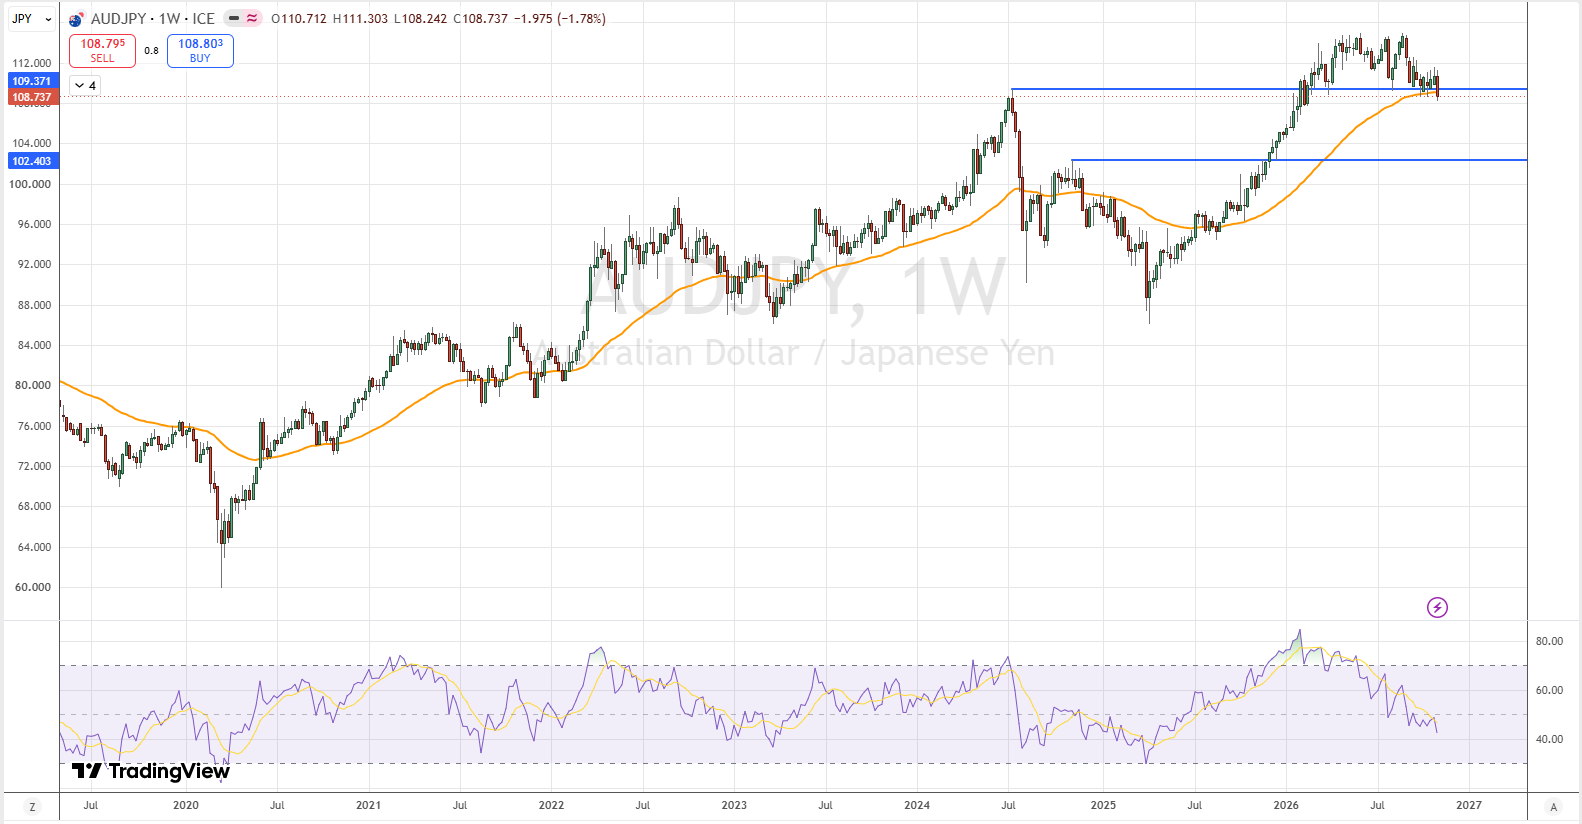
Chart notes:
As the market’s premier “risk-on proxy,” the dramatic weekly drop in AUD/JPY is not an isolated FX event. It is the mathematical culmination of weeks of shifting capital flows across global equities, central bank policies, and macroeconomic data.
- The Australian Dollar (AUD) as the Growth Proxy: The Aussie is heavily tied to global commodity demand, industrial manufacturing, and equity market momentum. When global markets sell off, capital flees the liquid AUD.
- The Japanese Yen (JPY) as the Funding Currency: The Yen acts as a safe-haven asset. It is heavily utilized in the global “carry trade,” where investors borrow cheap JPY to buy higher-yielding growth assets. When risk assets fall, investors are forced to liquidate positions and buy back JPY to pay off debts, causing the Yen to surge.
- Heading into late August, AUD/JPY was trading comfortably above the 114.00 level as the carry-trade was alive and well. Domestic Australian inflation data remained sticky, forcing the Reserve Bank of Australia (RBA) to maintain a strictly hawkish bias. The Bank of Japan (BOJ) had finally switched to a hiking posture but the interest rate differential (the carry) was still judged to be safe.
- The narrative fractured suddenly and sentiment soured as global equities experienced a sharp tech liquidation due to overextended AI valuations. Institutional funds immediately began unwinding their cross-asset carry trades. The forced liquidation of global equity portfolios automatically triggered massive buybacks of the Japanese Yen, sending AUD/JPY lower.
- A stronger-than-expected US Nonfarm Payrolls report (+165k) forced macro traders to price in a higher-for-longer path for the Federal Reserve. Higher global yields and a strengthening US Dollar further depressed commodity-linked currencies like the AUD, pushing AUD/JPY to breach the 109.00 level on a closing basis.
Pivot Points, Range Projections, Support & Resistance & Fibonacci Levels
Range (HIGH/LOW) predictions for the next trading period. The weighted pivot point may be viewed as a midpoint of market sentiment. If the market in the following period trades above the pivot point it is thought to be exhibiting bullish sentiment, whereas trading below the pivot point is seen as bearish. Fibonacci retracements determine potential reversal levels based on Fibonacci’s sequence.