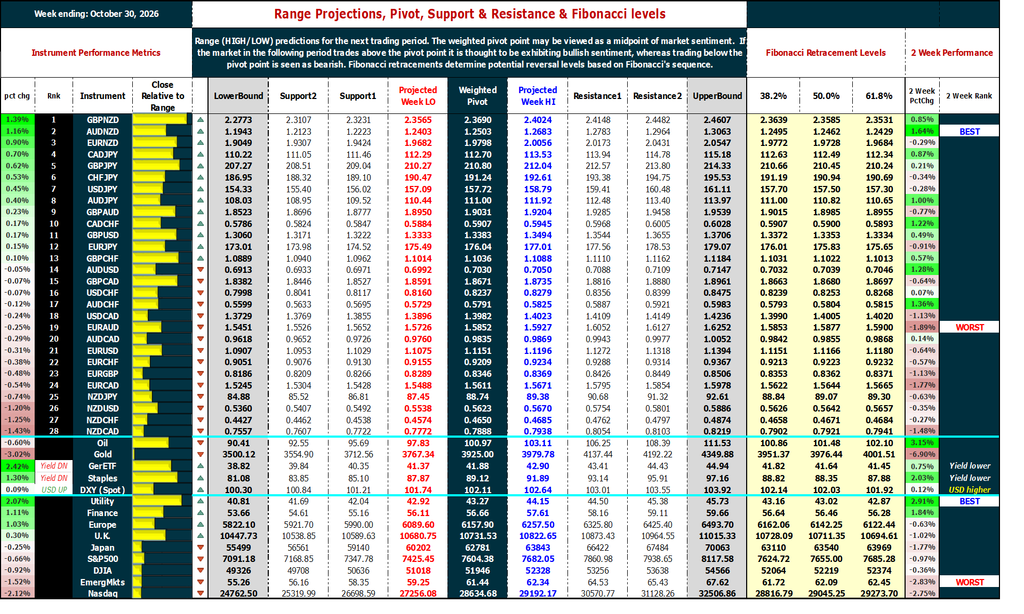
Market review and metrics for FX, Oil, Gold, Global Indices & Yields. Pivot points, Support, Resistance & Fibonacci Reversal levels and Chart of Interest.
Global markets overview
Strongest to Weakest
| CAD | GBP | CHF | USD | AUD | EUR | JPY | NZD |
|---|
| Market | Best Performer | Worst Performer |
|---|---|---|
| FX | GBPNZD | NZDCAD |
| Global Index / Sector | Utility | Nasdaq |
Global markets commentary
FX
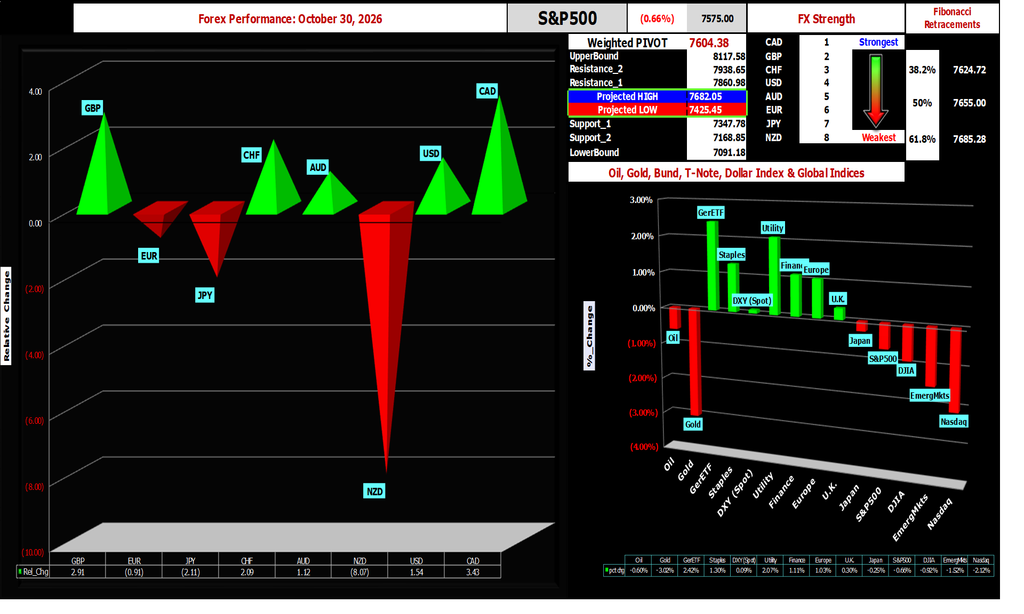
The Canadian dollar (CAD) finished as the strongest major for the week ending October 30, 2026, while the New Zealand dollar (NZD) was the clear laggard. Relative performance across the 28 pairs showed CAD at the top of the strength ranking, followed by GBP and CHF. NZD’s sharp underperformance (roughly –8% relative) stood out against a more mixed backdrop for the rest of the majors.
Pairs involving NZD on the short side dominated the top of the performance table (GBPNZD +1.39%, AUDNZD +1.16%, EURNZD +0.90%), while NZD crosses occupied most of the bottom ranks. The 2-week context reinforced the same directional bias for several of these pairs.
Why the moves: CAD strength aligned with relatively resilient North American commodity and rate dynamics plus a firmer DXY. NZD weakness was more pronounced and consistent with the broader risk-off tone visible in gold and growth equities, as well as the pair’s sensitivity to China-linked and soft-commodity sentiment. GBP held up reasonably well (second in the ranking), while JPY lagged among the majors. The net result was a clean long-CAD / short-NZD bias that produced the week’s best and worst FX outcomes.
Global Indices
Utility and Finance led the equity complex, while Nasdaq and Emerging Markets lagged. The S&P 500 finished the week modestly lower. Defensive/sector rotation themes were visible in the relative performance bars, with Utilities and Staples positive while growth-heavy Nasdaq underperformed.
Why the moves: The leadership from Utilities and Finance versus Nasdaq underperformance pointed to a rotation out of growth/tech into more defensive and rate-sensitive areas. This occurred alongside softer gold and mixed oil, consistent with markets pricing a less aggressive growth or liquidity impulse. Emerging Markets also finished near the bottom of the relative ranking.
Oil, Gold & Yields
Crude oil (WTI) was modestly lower on the week. Gold posted a larger decline (–3.02%). US 10-year yields moved higher (DXY also firmed).
Why the moves: The combination of softer gold and firmer yields aligned with a modest risk-off tone in parts of the FX complex (NZD weakness) while CAD strength suggested commodity or relative-rate support for the “loonie“. Oil’s milder decline kept the commodity-currency picture mixed rather than uniformly negative.
FX Performance Composite
This chart provides the visual summary of relative FX strength, S&P 500 pivot/Fibonacci levels, and the relative performance of Oil, Gold, DXY, and major global indices/sectors.
Chart(s) of Interest
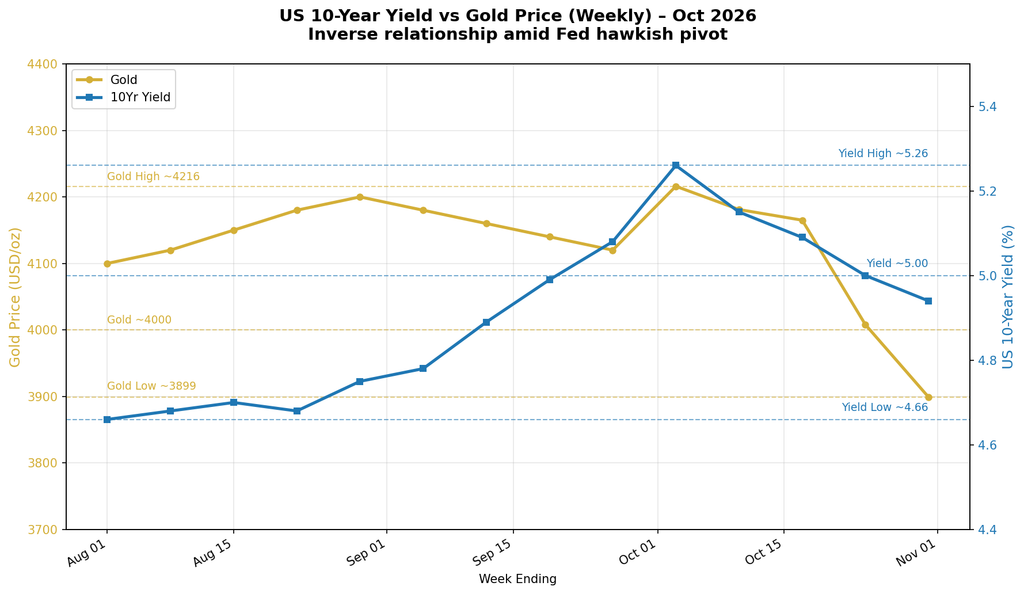
Chart notes:
- Gold’s absolute high of the year was $5,586.20 (intraday high) on 29 January 2026 (week of 25 January 2026). The weekly close that week was lower.
- By the week ending 30 October 2026, gold had closed near $3,899.
- The 10-year yield rose from the mid-4.6% area in August toward a high near 5.26% (on a weekly closing basis) in early October before easing back toward 4.94%. Absolute high of the yield move reached approximately 5.365%.
- The inverse relationship is visible over the broader period: the yield advance from the August lows coincided with gold’s decline from its January high, consistent with markets pricing a more hawkish Fed path (higher opportunity cost of holding non-yielding gold).
- The transition in Fed policy appears to have been a catalyst for the recent US stock market malaise — rotation out of tech & AI into the safety of the US Treasury market.
- Key levels (weekly closing basis):
- Gold: ~4,216 (early-October weekly close area), ~4,000 (psychological), ~3,899 (late-October weekly close). Absolute high of the move was $5,586.20 on 29 January 2026.
- Yield: ~5.26 (recent weekly close high), ~5.00, ~4.66 (August area weekly close low). Absolute high of the move reached ~5.365%.
Pivot Points, Range Projections, Support & Resistance & Fibonacci Levels
Range (HIGH/LOW) predictions for the next trading period. The weighted pivot point may be viewed as a midpoint of market sentiment. If the market in the following period trades above the pivot point it is thought to be exhibiting bullish sentiment, whereas trading below the pivot point is seen as bearish. Fibonacci retracements determine potential reversal levels based on Fibonacci’s sequence.