
| Date | 3-mth | 6-mth | 1-yr | 2-yr | 5-yr | 10-yr | 30-yr | Aaa | Baa | HY-OAS |
|---|---|---|---|---|---|---|---|---|---|---|
| 3/27/2026 | 3.73 | 3.75 | 3.77 | 3.88 | 4.06 | 4.44 | 4.98 | 5.66 | 6.22 | 3.42 |
| 3/20/2026 | 3.74 | 3.79 | 3.80 | 3.88 | 4.01 | 4.39 | 4.96 | 5.61 | 6.18 | 3.24 |
| 3/13/2026 | 3.72 | 3.70 | 3.66 | 3.73 | 3.87 | 4.28 | 4.90 | 5.60 | 6.11 | 3.28 |
| 3/6/2026 | 3.71 | 3.68 | 3.56 | 3.53 | 3.67 | 4.10 | 4.73 | 5.32 | 5.86 | 3.13 |
| 2/27/2026 | 3.68 | 3.61 | 3.48 | 3.42 | 3.58 | 4.02 | 4.64 | 5.25 | 5.77 | 3.10 |
| 2/20/2026 | 3.69 | 3.60 | 3.51 | 3.46 | 3.65 | 4.08 | 4.72 | 5.25 | 5.76 | 2.86 |
| 2/13/2026 | 3.68 | 3.59 | 3.42 | 3.40 | 3.61 | 4.04 | 4.69 | 5.31 | 5.81 | 2.95 |
| 2/6/2026 | 3.68 | 3.59 | 3.45 | 3.54 | 3.80 | 4.26 | 4.85 | 5.40 | 5.90 | 2.87 |
| 1/30/2026 | 3.67 | 3.61 | 3.48 | 3.54 | 3.81 | 4.24 | 4.87 | 5.35 | 5.86 | 2.80 |
This data confirms that the ‘Bear Steepener‘ is gaining momentum. For the second consecutive week, long-term yields rose while the short end remained anchored, pushing the curve into an even steeper, growth-oriented (but inflation-wary) slope.
YC analysis
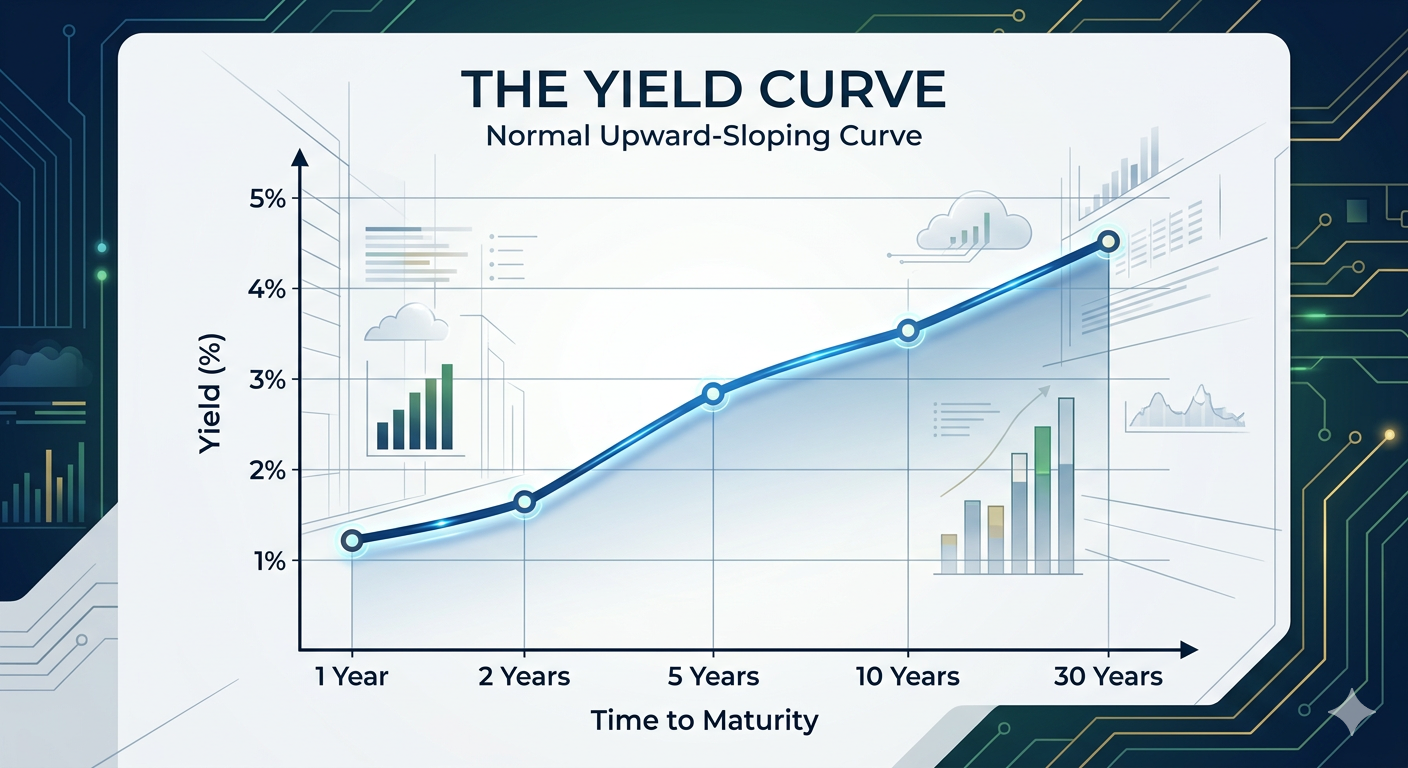
- YC normalizing: The curve is now a smooth, upward-sloping line from 3 months to 30 years, suggesting a total normalization of interest rate expectations.
- Long-End Surge: The 10-year (+5bp to 4.44%) and 30-year (+2bp to 4.98%) continued their march upward. This indicates the market is demanding a higher “term premium“ to compensate for long-term inflation risks and the heavy supply of government bonds.
- Short-End Stability: The 3-month (-1bp) and 6-month (-4bp) yields ticked down slightly; a clear sign that the Fed is seen as “on hold“ (3.73%), while the market is repricing the future much higher.
- “Fed Policy” (2yr – 3mo): A slight increase to +15bp. The market is coming to grips with the possibility that the “Terminal Rate” might already have been reached. The odds, though still very low, are starting to price in the possibility that the Fed’s next move might be a rate HIKE. Nevertheless, the YC suggests a stable, “neutral” policy environment in the near term.
- 10y-3m Spread (+71bp): This spread widened from +65bp last week. A widening positive spread is a definitive move away from recession signals and toward a pro-growth expansion narrative.
- 30y–2y Spread (+110bp): A widening of the gap between the 2-year and 30-year, confirming that the market sees the current “neutral” rate as much higher than previously thought. This is the theoretical long-term rate that neither stimulates nor restrains the economy.
Credit Risk & Spreads
- Aaa (High Investment Grade): At 5.66%, the yield rose in lockstep with Treasuries. The spread over the 30-year remains tight at +68bp, suggesting institutional appetite for top-tier corporate debt is still strong.
- Baa (Lower Investment Grade): The spread between Baa & 10-yr was +178bp, a sign that corporations still have access to capital. The +56bp gap between Aaa and Baa reflects a market that sees little difference in default risk between high and lower investment-grade companies.
- High-Yield OAS (Option-Adjusted Spread): This is the most critical move. The spread jumped +18bp in one week (+324 to +342). While still below historical averages — around +520bp — this “widening while rates rise” suggests that market “complacency” is beginning to fade as higher borrowing costs start to pinch lower-quality balance sheets.
MOVE Index
The ICE BofA U.S. Bond Market Option Volatility Estimate (MOVE) Index measures implied volatility of U.S. Treasury yields, derived from options on Treasuries (primarily 2Y–30Y maturities). It’s commonly called the “VIX for bonds”, but more precisely, it reflects the market’s expectation of how much Treasury yields will move, not bond prices.
- Current reading: 111.95 bp.
- Leading Indicator: Rate volatility often transmits into equity volatility because discount rates underpin asset valuations.
- Interpretation: Elevated volatility, not extreme, but signaling meaningful rate uncertainty which can spill into broader markets. Essentially, it’s the market’s best guess — 1σ range (68% probability) — that yields will move ± 1.12% over a 1-year horizon, assuming normal distribution.
- Expected 10yr ranges (by timeframe):
| Timeframe | Low (%) | High (%) |
|---|---|---|
| 1 day | 4.37 | 4.51 |
| 1 week | 4.28 | 4.60 |
| 1 month | 4.12 | 4.76 |
| 1 year | 3.32 | 5.56 |
Impact on Equities
- Equity Valuation Pressure: A note of caution for equity investors – the 10-year yield crossing the 4.00% threshold often acts as a headwind for stock market valuations (specifically tech/growth stocks), as the “discount rate” for future earnings increases. High-growth companies with earnings projected far into the future are most likely to be affected by this, as Price-to-Earnings (P/E) multiples will be pulled lower compared to the “ultra-low rate” era.
Most Discounted-Cash-Flow (DCF) models use the 10-yr as the “risk-free” rate. So, when the denominator in these formulas increases, it reduces the Present Value (PV) of future corporate earnings.
- Normal Equity Risk Premium (ERP): the extra return investors expect for choosing stocks over “safe” Treasuries is currently around its historical average. With the S&P 500 ERP estimated at roughly 5.85% (using forward P/E = 21.3x & Nominal GDP (2026) = 5.4%), signaling a “neutral” sentiment, the total expected return for stocks is more dependent on earnings growth rather than multiple expansion.
The “quality” of Nominal GDP is low, as the latest release of Real GDP (BEA) is only 0.7%, while inflation (GDP Price Deflator) is around 3.8%. This puts Nominal GDP (2025) at 4.5%. In other words, ~84.4% of the increase in the dollar value of the economy (Nominal GDP) was due to higher prices. If this trend continues, then the threat of Stagflation rises.
- Competitive Yields: For many investors, a 4.44% to 4.98% guaranteed return on Treasuries or a 5.6% to 6.2% yield on investment-grade bonds makes equities look “expensive” on a relative-value basis.
- Risk Appetite: While still below the long-term average of +520bp, the rising HY-OAS spread is a clear sign that investors are repricing risk.
- Small-Cap Headwinds: The jump in High Yield spreads (+18 bps) is a warning for small-caps. Since many rely on high-yield debt markets, the combination of higher base rates and wider spreads increases their refinancing risk.
- Confidence in Growth or Worries over Inflation: The steepening long end of the curve (10-yr & 30-yr rising) signals that investors either:
- expect solid economic growth and successful AI-related productivity gains, which justifies keeping equity valuations elevated despite high interest rates or
- are concerned about the US government needing to fund the deficit by flooding the market with massive bond issuances.
Bottom Line
- The narrative has shifted from “Will there be a recession?” to “How high can rates go before something breaks?” The Bear Steepener is now being accompanied by widening credit spreads, which is a more defensive signal than last week. Duration risk remains the primary threat to bondholders, but for equity holders, the “No Landing” scenario is starting to look expensive as the “Risk-Free” rate approaches 4.5% to 5% on the long end.
Duration risk: the measure of how sensitive a bond’s market price is to changes in interest rates, where a higher duration indicates a greater potential for the bond’s value to decline as rates rise.
| Metric | (bp) | Comment |
|---|---|---|
| 2yr - 3mo | +15 | Rate hike odds, though still low, are rising |
| 10yr - 3mo | +71 | Recession worries fading |
| 10yr - 2yr | +56 | Fairly robust signal of economic "normalization" |
| Aaa - 10yr | +122 | healthy, standard spread for top-tier credit, indicating no signs of stress in the plumbing of the financial system. |
| HY-OAS | +342 | A significant jump suggests that market “complacency” is beginning to fade as higher borrowing costs start to pinch lower-quality balance sheets. |
| MOVE Index | +111.95 | Elevated volatility, not extreme, but signaling meaningful rate uncertainty |
