Line chart. October 23, 2026. Data table with 2 rows and 9 columns follows.
| 3-mo | 6-mo | 1-yr | 2-yr | 5-yr | 10-yr | 30-yr | AaaAaa represents the highest rung of investment-grade corporate debt, indicating top-level creditworthiness and the lowest default risk. More | BaaBaa represent the lowest rung of investment-grade corporate debt with moderate credit risk, making them susceptible to higher default risk than Aaa bonds. More |
|---|---|---|---|---|---|---|---|---|
| 4.22 | 4.3 | 4.44 | 4.69 | 4.82 | 5 | 5.33 | 6 | 6.47 |
| Date | 3-mth | 6-mth | 1-yr | 2-yr | 5-yr | 10-yr | 30-yr | AaaAaa represents the highest rung of investment-grade corporate debt, indicating top-level creditworthiness and the lowest default risk. More | BaaBaa represent the lowest rung of investment-grade corporate debt with moderate credit risk, making them susceptible to higher default risk than Aaa bonds. More | HY-OAS | 5Y5Y5Y5Y forward rate provides a market-implied view of where policy ultimately settles once cyclical forces dissipate. Importantly, it captures the destination of policy rather than its near-term trajectory, and should be interpreted as a structural anchor rather than a tactical signal. More Forward | 5Y Breakeven Inflation | MOVE Index | |
|---|---|---|---|---|---|---|---|---|---|---|---|---|---|---|
| 10/23/2026 | 4.22 | 4.30 | 4.44 | 4.69 | 4.82 | 5.00 | 5.33 | 6 | 6.47 | 3.38 | 2.2 | 2.48 | 103.31 | |
| 10/16/2026 | 4.26 | 4.34 | 4.46 | 4.74 | 4.89 | 5.09 | 5.43 | 6.06 | 6.55 | 3.31 | 2.33 | 2.37 | 101.10 | |
| 10/9/2026 | 4.25 | 4.32 | 4.47 | 4.80 | 5.02 | 5.24 | 5.60 | 6.22 | 6.69 | 3.11 | 2.32 | 2.34 | 98.47 | |
| 10/2/2026 | 4.19 | 4.27 | 4.46 | 4.83 | 5.06 | 5.28 | 5.63 | 6.28 | 6.75 | 3.10 | 2.35 | 2.37 | 107.29 | |
| 9/25/2026 | 4.24 | 4.33 | 4.50 | 4.81 | 4.98 | 5.17 | 5.49 | 6.18 | 6.63 | 2.93 | 2.34 | 2.34 | 96.00 | |
| 9/18/2026 | 4.14 | 4.24 | 4.44 | 4.76 | 4.86 | 5.01 | 5.34 | 5.98 | 6.41 | 2.68 | 2.35 | 2.31 | 80.64 | |
| 9/11/2026 | 4.07 | 4.12 | 4.35 | 4.63 | 4.78 | 4.96 | 5.35 | 6.03 | 6.46 | 2.65 | 2.32 | 2.4 | 82.21 | |
| 9/4/2026 | 3.91 | 3.98 | 4.13 | 4.37 | 4.54 | 4.78 | 5.24 | 5.92 | 6.34 | 2.68 | 2.33 | 2.37 | 73.1 | |
| 8/28/2026 | 3.90 | 4.02 | 4.15 | 4.34 | 4.48 | 4.73 | 5.22 | 5.86 | 6.27 | 2.60 | 2.32 | 2.3 | 70.97 | |
| 8/21/2026 | 3.88 | 3.95 | 4.03 | 4.24 | 4.43 | 4.74 | 5.27 | 5.92 | 6.37 | 2.70 | 2.34 | 2.34 | 73.4 | |
| 8/14/2026 | 3.86 | 3.95 | 3.98 | 4.17 | 4.36 | 4.68 | 5.25 | 5.92 | 6.37 | 2.67 | 2.3 | 2.24 | 69.58 | |
| 8/7/2026 | 3.87 | 3.96 | 4.01 | 4.19 | 4.35 | 4.65 | 5.19 | 5.85 | 6.29 | 2.7 | 2.28 | 2.22 | 72.03 | |
| 7/31/2026 | 3.83 | 3.98 | 4.08 | 4.28 | 4.45 | 4.75 | 5.27 | 5.96 | 6.38 | 2.84 | 2.3 | 2.26 | 83.02 | |
| 7/24/2026 | 3.96 | 4.08 | 4.14 | 4.33 | 4.43 | 4.69 | 5.16 | 5.87 | 6.28 | 2.79 | 2.28 | 2.24 | 76.82 | |
| 7/17/2026 | 3.85 | 3.96 | 4.01 | 4.18 | 4.28 | 4.55 | 5.06 | 5.72 | 6.14 | 2.73 | 2.21 | 2.27 | 70.88 | |
| 7/10/2026 | 3.85 | 3.99 | 4.06 | 4.21 | 4.30 | 4.56 | 5.06 | 5.72 | 6.14 | 2.69 | 2.2 | 2.28 | 69.55 | |
| 7/3/2026 | 3.82 | 3.98 | 3.96 | 4.14 | 4.23 | 4.49 | 4.98 | 5.6 | 6.02 | 2.74 | 2.22 | 2.24 | 65.4 | |
| 6/26/2026 | 3.83 | 3.94 | 3.94 | 4.07 | 4.12 | 4.38 | 4.87 | 5.5 | 5.94 | 2.83 | 2.19 | 2.21 | 66.79 | |
| 6/19/2026 | 3.83 | 3.92 | 4.00 | 4.19 | 4.23 | 4.46 | 4.90 | 5.5 | 5.97 | 2.66 | 2.23 | 2.27 | 65.39 | |
| 6/12/2026 | 3.78 | 3.82 | 3.86 | 4.09 | 4.21 | 4.48 | 4.97 | 5.52 | 6.01 | 2.71 | 2.23 | 2.39 | 69.36 | |
| 6/5/2026 | 3.78 | 3.81 | 3.88 | 4.17 | 4.29 | 4.55 | 5.01 | 5.53 | 6.06 | 2.76 | 2.24 | 2.48 | 75.2 | |
| 5/29/2026 | 3.69 | 3.78 | 3.79 | 3.98 | 4.13 | 4.45 | 4.99 | 5.5 | 6.02 | 2.72 | 2.24 | 2.52 | 70.22 | |
| 5/22/2026 | 3.68 | 3.79 | 3.86 | 4.13 | 4.27 | 4.56 | 5.07 | 5.61 | 6.13 | 2.74 | 2.26 | 2.54 | 78.43 | |
| 5/15/2026 | 3.69 | 3.77 | 3.82 | 4.09 | 4.26 | 4.59 | 5.12 | 5.65 | 6.21 | 2.80 | 2.28 | 2.7 | 79.87 | |
| 5/8/2026 | 3.69 | 3.74 | 3.75 | 3.90 | 4.02 | 4.38 | 4.95 | 5.47 | 6.03 | 2.81 | 2.28 | 2.62 | 67.25 | |
| 5/1/2026 | 3.68 | 3.71 | 3.73 | 3.88 | 4.02 | 4.39 | 4.97 | 5.49 | 6.08 | 2.77 | 2.27 | 2.69 | 70.41 | |
| 4/24/2026 | 3.69 | 3.71 | 3.67 | 3.78 | 3.92 | 4.31 | 4.91 | 5.41 | 6.01 | 2.86 | 2.23 | 2.61 | 66.97 | |
| 4/17/2026 | 3.70 | 3.69 | 3.64 | 3.71 | 3.84 | 4.26 | 4.88 | 5.36 | 5.98 | 2.83 | 2.16 | 2.56 | 65.7 | |
| 4/10/2026 | 3.69 | 3.72 | 3.70 | 3.81 | 3.94 | 4.31 | 4.91 | 5.42 | 6.03 | 2.94 | 2.14 | 2.58 | 72.15 | |
| 4/3/2026 | 3.71 | 3.73 | 3.72 | 3.84 | 3.99 | 4.35 | 4.91 | 5.44 | 6.05 | 3.13 | 2.11 | 2.61 | 81.78 | |
| 3/27/2026 | 3.73 | 3.75 | 3.77 | 3.88 | 4.06 | 4.44 | 4.98 | 5.66 | 6.22 | 3.42 | 2.06 | 2.56 | 111.95 | |
| 3/20/2026 | 3.74 | 3.79 | 3.80 | 3.88 | 4.01 | 4.39 | 4.96 | 5.61 | 6.18 | 3.24 | 2.13 | 2.63 | 108.84 | |
| 3/13/2026 | 3.72 | 3.70 | 3.66 | 3.73 | 3.87 | 4.28 | 4.90 | 5.60 | 6.11 | 3.28 | 2.11 | 2.61 | 91.17 | |
| 3/6/2026 | 3.71 | 3.68 | 3.56 | 3.53 | 3.67 | 4.10 | 4.73 | 5.32 | 5.86 | 3.13 | 2.14 | 2.56 | 81.26 | |
| 2/27/2026 | 3.68 | 3.61 | 3.48 | 3.42 | 3.58 | 4.02 | 4.64 | 5.25 | 5.77 | 3.10 | 2.1 | 2.40 | 73.38 | |
| 2/20/2026 | 3.69 | 3.60 | 3.51 | 3.46 | 3.65 | 4.08 | 4.72 | 5.25 | 5.76 | 2.86 | 2.13 | 2.43 | 64.27 | |
| 2/13/2026 | 3.68 | 3.59 | 3.42 | 3.40 | 3.61 | 4.04 | 4.69 | 5.31 | 5.81 | 2.95 | 2.12 | 2.42 | 70.1 | |
| 2/6/2026 | 3.68 | 3.59 | 3.45 | 3.54 | 3.80 | 4.26 | 4.85 | 5.40 | 5.90 | 2.87 | 2.18 | 2.50 | 63.62 | |
| 1/30/2026 | 3.67 | 3.61 | 3.48 | 3.54 | 3.81 | 4.24 | 4.87 | 5.35 | 5.86 | 2.80 | 2.19 | 2.53 | 59.2 |
Source: Federal Reserve Economic Data (FRED) is an online database created and maintained by the Research Department at the Federal Reserve Bank of St. Louis
LONG-END RALLY | CURVE FLATTENS FURTHER | CREDIT RISK WIDENS AS INFLATION SIGNALS DIVERGE
The Treasury market extended its rally, with yields declining across all maturity segments. The front end eased modestly, with the 3M–1Y sector falling 1–4bp, while the 2Y–5Y sector declined 5–7bp. The long end led the move: the 10Y fell 9bp to 5.00% and the 30Y declined 10bp to 5.33%.
Curve geometry confirms further flattening. The 10Y–3M spread narrowed 5bp to 78bp, while the 30Y–2Y spread also compressed 5bp to 64bp. Because yields declined across the curve, this is best classified as a long-end-led bull flatteningA bull flattener is a yield curve shift where long-term bond yields fall faster than short-term yields, flattening the curve. It is "bullish" for bond prices—particularly long-duration bonds—and often signals investor fear of an economic slowdown, acting as a "flight to safety". More, rather than a parallel rally. The larger declines in the 10Y and 30Y show that durationBond Duration: Estimates the percentage change in a bond’s price for every 1% shift in interest rates. For example, a bond with a 3-year duration will gain or lose roughly ±3% of its value if rates fall or rise by 1%. More outperformed the front end.
The cross-market picture remains cautious. The MOVE Index rose 2.21 points to 103.31, while HY OAS widened 7bp to 338bp. Investment-grade yields declined, but high-yield spreads widened further. Lower Treasury yields therefore coincided with greater rates volatility and deteriorating high-yield risk pricing.
FedWatch shifted further toward a 25bp increase in December and January, while the probability distribution for March moved toward a 25bp rather than a 50bp increase. The market is repricing the distribution of future tightening, not simply moving uniformly toward a more or less restrictive path.
The central signal is a sustained Treasury rally alongside persistent policy restrictiveness and deteriorating credit conditions. The combination is consistent with defensive demand for durationBond Duration: Estimates the percentage change in a bond’s price for every 1% shift in interest rates. For example, a bond with a 3-year duration will gain or lose roughly ±3% of its value if rates fall or rise by 1%. More amid equity-market uncertainty, but the available indicators do not establish that flight-to-safety flows are the sole driver. Higher breakeven inflation, lower forward inflation expectations, and wider credit spreadsIn the bond market, it is the difference in yield between a corporate bond and a "risk-free" government bond of the same maturity. It represents the extra interest investors demand to compensate for the risk that a company might default. More point to a more complicated macroeconomic picture than a straightforward easing of inflation or financial conditions.
Macro Structure
-
-
-
- Front end:
- 3M → 4.22% (↓ -4bp)
- 6M → 4.30% (↓ -4bp)
- 1Y → 4.44% (↓ -2bp)
- Front end:
-
-
→ The front end declined modestly across the segment. The 3M and 6M fell 4bp, while the 1Y declined 2bp. This represents a small easing in short-maturity yields, but not a wholesale repricing toward monetary accommodation.
FedWatch reinforces that distinction. October pricing was unchanged, while December and January became more concentrated on a 25bp increase. The decline in short Treasury yields therefore occurred alongside continued expectations of near-term tightening.
→ The front end eased marginally, but the policy distribution remains centered on further tightening rather than imminent easing.
-
-
-
- Belly:
- 2Y → 4.69% (↓ -5bp)
- 5Y → 4.82% (↓ -7bp)
- Belly:
-
-
→ The belly rallied more strongly than the front end, with the 5Y outperforming the 2Y by 2bp. The decline in intermediate yields contrasts with the increasingly concentrated December and January hike probabilities.
This divergence is not inherently contradictory. FedWatch reflects meeting-specific policy outcomes, whereas intermediate Treasury yields incorporate expectations over a broader horizon, including future policy, inflation, real yields, and term premiumThe "extra" return investors demand for holding a long-term bond instead of a series of short-term ones. It acts as a safety buffer, compensating the lender for the increased risk that inflation or interest rates might change unexpectedly over a longer period. More. The supplied data do not isolate the contribution of each factor.
→ The belly’s rally indicates lower intermediate yields, but does not independently establish that the market expects a less restrictive Fed over the full policy horizon.
-
-
-
- Long end:
- 10Y → 5.00% (↓ -9bp)
- 30Y → 5.33% (↓ -10bp)
- Long end:
-
-
→ The long end led the weekly rally. The 10Y declined 9bp and the 30Y fell 10bp, continuing the decline in long-durationBond Duration: Estimates the percentage change in a bond’s price for every 1% shift in interest rates. For example, a bond with a 3-year duration will gain or lose roughly ±3% of its value if rates fall or rise by 1%. More yields from the October 9 levels.
The 10Y is now 50bp above the 4.50% equity valuation threshold, down from 59bp above it last week. This is a further reduction in discount-rate pressure, although a 5.00% 10Y yield remains elevated. The 30Y at 5.33% likewise continues to offer a substantial nominal yield.
The move is consistent with stronger demand for durationBond Duration: Estimates the percentage change in a bond’s price for every 1% shift in interest rates. For example, a bond with a 3-year duration will gain or lose roughly ±3% of its value if rates fall or rise by 1%. More, potentially including defensive flows amid equity-market uncertainty. However, the yield data alone cannot distinguish safe-haven buying from changes in real yields, term premiumThe "extra" return investors demand for holding a long-term bond instead of a series of short-term ones. It acts as a safety buffer, compensating the lender for the increased risk that inflation or interest rates might change unexpectedly over a longer period. More, or other positioning effects.
→ The long end continues to lead the rally, providing some relief to equity discount ratesThe interest rate used to determine what a future sum of money is worth today. It accounts for the "time value of money"—the principle that a dollar today is worth more than a dollar tomorrow—and the risk that a future payment might not actually be received. More without establishing a durable reversal in the broader rate environment.
Curve & Inflation Signals
The curve flattened further as yields declined more sharply at longer maturities.
-
-
-
- 10Y–3M spread: +78bp (↓ -5bp)
- 30Y–2Y spread: +64bp (↓ -5bp)
-
-
→ The configuration is best described as a long-end-led bull flatteningA bull flattener is a yield curve shift where long-term bond yields fall faster than short-term yields, flattening the curve. It is "bullish" for bond prices—particularly long-duration bonds—and often signals investor fear of an economic slowdown, acting as a "flight to safety". More. Both spreads narrowed by 5bp, while the long end experienced the largest absolute yield declines. Unlike a parallel rally, the move reflects stronger price appreciation in longer-duration Treasuries.
Inflation measures diverged:
-
-
-
- 5Y5Y5Y5Y forward rate provides a market-implied view of where policy ultimately settles once cyclical forces dissipate. Importantly, it captures the destination of policy rather than its near-term trajectory, and should be interpreted as a structural anchor rather than a tactical signal. More Forward: 2.20% (↓ -13bp)
- 5Y Breakeven Inflation: 2.48% (↑ +11bp)
-
-
The 13bp decline in the 5Y5Y5Y5Y forward rate provides a market-implied view of where policy ultimately settles once cyclical forces dissipate. Importantly, it captures the destination of policy rather than its near-term trajectory, and should be interpreted as a structural anchor rather than a tactical signal. More forward contrasts sharply with the 11bp increase in the 5Y breakeven. These measures cover different inflation horizons and are not interchangeable. The divergence suggests that near-term and longer-horizon inflation compensation are sending different signals.
Breakevens also incorporate inflation risk premia and technical factors, so neither measure should be interpreted as a pure forecast of realized inflation. The decline in nominal Treasury yields cannot be attributed to a uniform decline in inflation expectations.
→ The curve’s geometry confirms a bull flatteningA bull flattener is a yield curve shift where long-term bond yields fall faster than short-term yields, flattening the curve. It is "bullish" for bond prices—particularly long-duration bonds—and often signals investor fear of an economic slowdown, acting as a "flight to safety". More, but the inflation signals remain mixed. The rally may reflect changing growth or risk perceptions, durationBond Duration: Estimates the percentage change in a bond’s price for every 1% shift in interest rates. For example, a bond with a 3-year duration will gain or lose roughly ±3% of its value if rates fall or rise by 1%. More demand, or other yield components; the available data do not establish a single dominant cause.
Fed Policy Expectations
FedWatch shifted further toward a 25bp increase in December and January, while March moved toward a smaller cumulative increase relative to the previous distribution. October pricing was unchanged.
-
-
-
-
October 28
-
-25bp: 10.19% (unchanged)
-
No Change: 75.89% (unchanged)
-
+25bp: 13.93% (unchanged)
-
-
-
-
→ October pricing remains unchanged, with no change the dominant outcome at 75.89%. There is no additional weekly repricing at the next meeting.
-
-
-
-
December 9
-
No Change: 5.38%, down from 6.27%
-
+25bp: 89.81%, up from 86.39%
-
+50bp: 4.81%, down from 7.34%
-
-
-
-
→ December became more concentrated on a 25bp increase. Its probability rose 3.42 percentage points, while both no change and a 50bp increase declined. The distribution points to a more specific expectation of a single 25bp move rather than a larger cumulative increase at that meeting.
-
-
-
-
January 27
-
No Change: 3.86%, down from 8.62%
-
+25bp: 92.58%, up from 80.42%
-
+50bp: 3.56%, down from 10.97%
-
-
-
-
→ January showed a stronger concentration shift. The +25bp outcome rose 12.16 percentage points, while the probabilities of no change and +50bp declined. The market is increasingly concentrated on a 25bp increase rather than either no change or a 50bp move.
Further out, the distribution changed meaningfully:
-
-
-
-
March 17: +25bp 37.57%, up from 16.00%; +50bp 62.43%, down from 84.00%
-
April 28: +25bp 5.70%, down from 12.82%; +50bp 94.30%, up from 87.17%
-
June 9: +50bp 100.00% (unchanged)
-
-
-
March shifted sharply toward a 25bp outcome, reducing the probability assigned to a 50bp increase by 21.57 percentage points. April moved in the opposite direction, becoming more concentrated on +50bp. June remains unchanged at 100% for +50bp.
The distribution is therefore not uniformly more or less hawkish. December and January increasingly favor a 25bp increase, March assigns less probability to a 50bp increase, and April places greater weight on that larger move. These are meeting-specific distributions, not a single cumulative probability that can be read independently of the path between meetings.
→ FedWatch indicates continued near-term tightening expectations but a redistribution of the size and timing of later moves. The Treasury rally should not be interpreted as direct evidence that markets expect the Fed to ease. Rather, the curve and FedWatch are reflecting different horizons and potentially different drivers.
Credit Markets
Credit conditions weakened further in high yield, even as investment-grade yields declined alongside Treasuries.
-
-
-
- AaaAaa represents the highest rung of investment-grade corporate debt, indicating top-level creditworthiness and the lowest default risk. More: 6.00% (↓ -6bp)
- BaaBaa represent the lowest rung of investment-grade corporate debt with moderate credit risk, making them susceptible to higher default risk than Aaa bonds. More: 6.47% (↓ -8bp)
- Baa–AaaAaa represents the highest rung of investment-grade corporate debt, indicating top-level creditworthiness and the lowest default risk. More spread: +47bp (↓ -2bp)
- HY OAS: 3.38% (↑ +7bp)
-
-
→ AaaAaa represents the highest rung of investment-grade corporate debt, indicating top-level creditworthiness and the lowest default risk. More and BaaBaa represent the lowest rung of investment-grade corporate debt with moderate credit risk, making them susceptible to higher default risk than Aaa bonds. More corporate yields declined 6bp and 8bp, respectively. The Baa–AaaAaa represents the highest rung of investment-grade corporate debt, indicating top-level creditworthiness and the lowest default risk. More differential narrowed from 49bp to 47bp, indicating a modest improvement in the relative yield gap between these investment-grade categories.
High yield moved in the opposite direction. HY OAS widened from 331bp to 338bp, a 7bp increase. This extends the deterioration in high-yield risk pricing seen last week and leaves the spread materially wider than at the October 9 baseline of 311bp.
The contrast matters. Lower Treasury yields and investment-grade yields ease benchmark borrowing costs, but wider high-yield spreads indicate that investors are demanding greater compensation for credit risk. The improvement in the investment-grade differential does not offset the deterioration in high-yield pricing.
→ Credit remains a constraint on interpreting the Treasury rally as a broad improvement in financial conditions. Investment-grade yields eased, but high-yield risk pricing continued to deteriorate.
MOVE Index
The ICE Bank of America U.S. Bond Market Option Volatility Estimate (MOVE) Index measures implied volatility of U.S. Treasury yields, derived from options on Treasuries (primarily 2Y–30Y maturities). It’s commonly called the “VIX for bonds”, but more precisely, it reflects the market’s expectation of how much Treasury yields will move, not bond prices. It is a critical cross-asset signal.
The ICE BofA U.S. Bond Market Option Volatility Estimate (MOVE) Index is the primary gauge of expected volatility in the U.S. Treasury market. Often called the "VIX for bonds," it measures market sentiment and interest rate risk by tracking the implied volatility of U.S. Treasury options.
| Date | bp |
|---|---|
| 1/3/2020 | 60.12 |
| 1/10/2020 | 60.12 |
| 1/17/2020 | 53.32 |
| 1/24/2020 | 49.67 |
| 1/31/2020 | 59.94 |
| 2/7/2020 | 72.98 |
| 2/14/2020 | 65.59 |
| 2/21/2020 | 62.38 |
| 2/28/2020 | 74.54 |
| 3/6/2020 | 109.67 |
| 3/13/2020 | 125.21 |
| 3/20/2020 | 138.4 |
| 3/27/2020 | 133.37 |
| 4/3/2020 | 88.33 |
| 4/10/2020 | 65.01 |
| 4/17/2020 | 74.39 |
| 4/24/2020 | 69.84 |
| 5/1/2020 | 66.09 |
| 5/8/2020 | 48.11 |
| 5/15/2020 | 57.4 |
| 5/22/2020 | 56.53 |
| 5/29/2020 | 51.67 |
| 6/5/2020 | 51.55 |
| 6/12/2020 | 61.97 |
| 6/19/2020 | 55.81 |
| 6/26/2020 | 53.45 |
| 7/3/2020 | 51.21 |
| 7/10/2020 | 50.96 |
| 7/17/2020 | 49.19 |
| 7/24/2020 | 45.68 |
| 7/31/2020 | 42.48 |
| 8/7/2020 | 41.98 |
| 8/14/2020 | 41.46 |
| 8/21/2020 | 43.09 |
| 8/28/2020 | 45.14 |
| 9/4/2020 | 48.19 |
| 9/11/2020 | 47.04 |
| 9/18/2020 | 43.12 |
| 9/25/2020 | 37.24 |
| 10/2/2020 | 36.97 |
| 10/9/2020 | 39.97 |
| 10/16/2020 | 57.52 |
| 10/23/2020 | 57.25 |
| 10/30/2020 | 58.46 |
| 11/6/2020 | 61.91 |
| 11/13/2020 | 39.88 |
| 11/20/2020 | 42.95 |
| 11/27/2020 | 42.31 |
| 12/4/2020 | 39.64 |
| 12/11/2020 | 43.89 |
| 12/18/2020 | 47.52 |
| 12/25/2020 | 44.64 |
| 1/1/2021 | 42.11 |
| 1/8/2021 | 48.98 |
| 1/15/2021 | 44.81 |
| 1/22/2021 | 45.14 |
| 1/29/2021 | 43.09 |
| 2/5/2021 | 47.41 |
| 2/12/2021 | 47.2 |
| 2/19/2021 | 47.01 |
| 2/26/2021 | 60.43 |
| 3/5/2021 | 75.66 |
| 3/12/2021 | 69.37 |
| 3/19/2021 | 70.83 |
| 3/26/2021 | 68.8 |
| 4/2/2021 | 61.49 |
| 4/9/2021 | 63.71 |
| 4/16/2021 | 61.21 |
| 4/23/2021 | 62.57 |
| 4/30/2021 | 59.98 |
| 5/7/2021 | 58.13 |
| 5/14/2021 | 54.13 |
| 5/21/2021 | 54.99 |
| 5/28/2021 | 54.59 |
| 6/4/2021 | 52.04 |
| 6/11/2021 | 49.78 |
| 6/18/2021 | 50.85 |
| 6/25/2021 | 60.45 |
| 7/2/2021 | 55.58 |
| 7/9/2021 | 52.41 |
| 7/16/2021 | 59.92 |
| 7/23/2021 | 58.24 |
| 7/30/2021 | 65.28 |
| 8/6/2021 | 61.19 |
| 8/13/2021 | 62.64 |
| 8/20/2021 | 55.45 |
| 8/27/2021 | 59.95 |
| 9/3/2021 | 57.98 |
| 9/10/2021 | 53.26 |
| 9/17/2021 | 51.73 |
| 9/24/2021 | 56.06 |
| 10/1/2021 | 58.46 |
| 10/8/2021 | 57.38 |
| 10/15/2021 | 59.65 |
| 10/22/2021 | 62.7 |
| 10/29/2021 | 72.04 |
| 11/5/2021 | 75.45 |
| 11/12/2021 | 66.9 |
| 11/19/2021 | 78.61 |
| 11/26/2021 | 73.39 |
| 12/3/2021 | 89.45 |
| 12/10/2021 | 79.14 |
| 12/17/2021 | 74.36 |
| 12/24/2021 | 72.46 |
| 12/31/2021 | 77.29 |
| 1/7/2022 | 77.1 |
| 1/14/2022 | 74.69 |
| 1/21/2022 | 76.59 |
| 1/28/2022 | 81.03 |
| 2/4/2022 | 85.29 |
| 2/11/2022 | 87.68 |
| 2/18/2022 | 94.03 |
| 2/25/2022 | 94.36 |
| 3/4/2022 | 93.34 |
| 3/11/2022 | 131.82 |
| 3/18/2022 | 99.03 |
| 3/25/2022 | 91.77 |
| 4/1/2022 | 125.27 |
| 4/8/2022 | 108.34 |
| 4/15/2022 | 124.86 |
| 4/22/2022 | 119.66 |
| 4/29/2022 | 128.12 |
| 5/6/2022 | 128.4 |
| 5/13/2022 | 121.42 |
| 5/20/2022 | 114.61 |
| 5/27/2022 | 111.1 |
| 6/3/2022 | 98.48 |
| 6/10/2022 | 97.73 |
| 6/17/2022 | 114.23 |
| 6/24/2022 | 133.75 |
| 7/1/2022 | 127 |
| 7/8/2022 | 144.17 |
| 7/15/2022 | 145.25 |
| 7/22/2022 | 129.85 |
| 7/29/2022 | 123.7 |
| 8/5/2022 | 116.36 |
| 8/12/2022 | 122.58 |
| 8/19/2022 | 106.28 |
| 8/26/2022 | 123.81 |
| 9/2/2022 | 122.95 |
| 9/9/2022 | 120.72 |
| 9/16/2022 | 121.54 |
| 9/23/2022 | 124.95 |
| 9/30/2022 | 137.28 |
| 10/7/2022 | 141.89 |
| 10/14/2022 | 148.46 |
| 10/21/2022 | 152.89 |
| 10/28/2022 | 156.95 |
| 11/4/2022 | 144.6 |
| 11/11/2022 | 128.44 |
| 11/18/2022 | 111.69 |
| 11/25/2022 | 129.33 |
| 12/2/2022 | 129.6 |
| 12/9/2022 | 118.62 |
| 12/16/2022 | 132.79 |
| 12/23/2022 | 113.65 |
| 12/30/2022 | 113.17 |
| 1/6/2023 | 121.61 |
| 1/13/2023 | 113.87 |
| 1/20/2023 | 113.55 |
| 1/27/2023 | 114.76 |
| 2/3/2023 | 100.7 |
| 2/10/2023 | 98.99 |
| 2/17/2023 | 109.63 |
| 2/24/2023 | 110.11 |
| 3/3/2023 | 122.84 |
| 3/10/2023 | 122.52 |
| 3/17/2023 | 140.06 |
| 3/24/2023 | 180.11 |
| 3/31/2023 | 173.66 |
| 4/7/2023 | 135.93 |
| 4/14/2023 | 139.2 |
| 4/21/2023 | 118.84 |
| 4/28/2023 | 120.84 |
| 5/5/2023 | 122.46 |
| 5/12/2023 | 130.21 |
| 5/19/2023 | 120.52 |
| 5/26/2023 | 127.51 |
| 6/2/2023 | 145.37 |
| 6/9/2023 | 120.95 |
| 6/16/2023 | 115.77 |
| 6/23/2023 | 104.43 |
| 6/30/2023 | 105.74 |
| 7/7/2023 | 110.64 |
| 7/14/2023 | 130.41 |
| 7/21/2023 | 112.48 |
| 7/28/2023 | 106.66 |
| 8/4/2023 | 109.76 |
| 8/11/2023 | 115.91 |
| 8/18/2023 | 112.13 |
| 8/25/2023 | 120.51 |
| 9/1/2023 | 110.37 |
| 9/8/2023 | 102.92 |
| 9/15/2023 | 104.34 |
| 9/22/2023 | 96.61 |
| 9/29/2023 | 101.11 |
| 10/6/2023 | 113.55 |
| 10/13/2023 | 126.64 |
| 10/20/2023 | 128.33 |
| 10/27/2023 | 135.45 |
| 11/3/2023 | 129.16 |
| 11/10/2023 | 118.74 |
| 11/17/2023 | 116.79 |
| 11/24/2023 | 113.11 |
| 12/1/2023 | 107.43 |
| 12/8/2023 | 111.51 |
| 12/15/2023 | 121.65 |
| 12/22/2023 | 115.75 |
| 12/29/2023 | 111.38 |
| 1/5/2024 | 114.62 |
| 1/12/2024 | 116.19 |
| 1/19/2024 | 106.51 |
| 1/26/2024 | 104.97 |
| 2/2/2024 | 100.23 |
| 2/9/2024 | 106.72 |
| 2/16/2024 | 106.21 |
| 2/23/2024 | 109.2 |
| 3/1/2024 | 108.31 |
| 3/8/2024 | 106.48 |
| 3/15/2024 | 100.88 |
| 3/22/2024 | 97.82 |
| 3/29/2024 | 91.04 |
| 4/5/2024 | 86.38 |
| 4/12/2024 | 94.31 |
| 4/19/2024 | 112.82 |
| 4/26/2024 | 111.26 |
| 5/3/2024 | 104.4 |
| 5/10/2024 | 95.96 |
| 5/17/2024 | 94.23 |
| 5/24/2024 | 89.35 |
| 5/31/2024 | 83.57 |
| 6/7/2024 | 91.14 |
| 6/14/2024 | 91.82 |
| 6/21/2024 | 100.16 |
| 6/28/2024 | 94.09 |
| 7/5/2024 | 98.59 |
| 7/12/2024 | 98.78 |
| 7/19/2024 | 86.79 |
| 7/26/2024 | 94.29 |
| 8/2/2024 | 97.76 |
| 8/9/2024 | 112.26 |
| 8/16/2024 | 108.26 |
| 8/23/2024 | 102.81 |
| 8/30/2024 | 105.63 |
| 9/6/2024 | 107.77 |
| 9/13/2024 | 107.24 |
| 9/20/2024 | 100.6 |
| 9/27/2024 | 91 |
| 10/4/2024 | 92.53 |
| 10/11/2024 | 100.15 |
| 10/18/2024 | 118.47 |
| 10/25/2024 | 123.13 |
| 11/1/2024 | 128.4 |
| 11/8/2024 | 132.58 |
| 11/15/2024 | 99.85 |
| 11/22/2024 | 102.47 |
| 11/29/2024 | 99.14 |
| 12/6/2024 | 95.22 |
| 12/13/2024 | 83.2 |
| 12/20/2024 | 85.66 |
| 12/27/2024 | 91.75 |
| 1/3/2025 | 94.8 |
| 1/10/2025 | 93.35 |
| 1/17/2025 | 96.57 |
| 1/24/2025 | 95.6 |
| 1/31/2025 | 86.75 |
| 2/7/2025 | 91.76 |
| 2/14/2025 | 93.13 |
| 2/21/2025 | 84.67 |
| 2/28/2025 | 91.83 |
| 3/7/2025 | 104.46 |
| 3/14/2025 | 104.41 |
| 3/21/2025 | 101.01 |
| 3/28/2025 | 94.54 |
| 4/4/2025 | 96.83 |
| 4/11/2025 | 125.71 |
| 4/18/2025 | 137.26 |
| 4/25/2025 | 114.64 |
| 5/2/2025 | 105.79 |
| 5/9/2025 | 101.4 |
| 5/16/2025 | 100.4 |
| 5/23/2025 | 96.7 |
| 5/30/2025 | 100.91 |
| 6/6/2025 | 92.11 |
| 6/13/2025 | 89.65 |
| 6/20/2025 | 95.31 |
| 6/27/2025 | 90.1 |
| 7/4/2025 | 87.93 |
| 7/11/2025 | 86.09 |
| 7/18/2025 | 85.48 |
| 7/25/2025 | 83.29 |
| 8/1/2025 | 82.09 |
| 8/8/2025 | 83.83 |
| 8/15/2025 | 79.2 |
| 8/22/2025 | 76.66 |
| 8/29/2025 | 78.1 |
| 9/5/2025 | 79.39 |
| 9/12/2025 | 85.29 |
| 9/19/2025 | 73.37 |
| 9/26/2025 | 72.51 |
| 10/3/2025 | 74.38 |
| 10/10/2025 | 69.53 |
| 10/17/2025 | 81.65 |
| 10/24/2025 | 78.62 |
| 10/31/2025 | 68.94 |
| 11/7/2025 | 66.61 |
| 11/14/2025 | 74.41 |
| 11/21/2025 | 79.71 |
| 11/28/2025 | 78.81 |
| 12/5/2025 | 68.95 |
| 12/12/2025 | 67.28 |
| 12/19/2025 | 69.25 |
| 12/26/2025 | 59.41 |
| 1/2/2026 | 58.5 |
| 1/9/2026 | 62.36 |
| 1/16/2026 | 61.55 |
| 1/23/2026 | 58.05 |
| 1/30/2026 | 56.25 |
| 2/6/2026 | 59.2 |
| 2/13/2026 | 63.62 |
| 2/20/2026 | 70.1 |
| 2/27/2026 | 64.27 |
| 3/6/2026 | 73.38 |
| 3/13/2026 | 81.26 |
| 3/20/2026 | 91.17 |
| 3/27/2026 | 108.84 |
| 4/3/2026 | 111.95 |
| 4/10/2026 | 81.78 |
| 4/17/2026 | 72.15 |
| 4./24/2026 | 65.7 |
| 5/1/2026 | 66.97 |
| 5/8/2026 | 70.41 |
| 5/15/2026 | 67.25 |
| 5/22/2026 | 79.87 |
| 5/29/2026 | 78.43 |
| 6/5/2026 | 70.22 |
| 6/12/2026 | 75.2 |
| 6/19/2026 | 69.36 |
| 6/26/2026 | 65.39 |
| 7/3/2026 | 66.79 |
| 7/10/2026 | 65.4 |
| 7/17/2026 | 69.55 |
| 7/24/2026 | 70.88 |
| 7/31/2026 | 76.82 |
| 8/7/2026 | 83.02 |
| 8/14/2026 | 72.03 |
| 8/21/2026 | 69.58 |
| 8/28/2026 | 73.4 |
| 9/4/2026 | 70.97 |
| 9/11/2026 | 73.1 |
| 9/18/2026 | 82.21 |
| 9/25/2026 | 80.64 |
| 10/2/2026 | 96 |
| 10/9/2026 | 107.29 |
| 10/16/2026 | 98.47 |
| 10/23/2026 | 101.1 |
| 10/30/2026 | 103.31 |
-
-
-
- Current reading: 103.31(↑ +2.21 points)
- Leading Indicator: Rate volatility often transmits into equity volatility because discount ratesThe interest rate used to determine what a future sum of money is worth today. It accounts for the "time value of money"—the principle that a dollar today is worth more than a dollar tomorrow—and the risk that a future payment might not actually be received. More underpin asset valuations.
- Trend: MOVE rose for a second consecutive week, moving further above 100.
- Interpretation: The increase indicates that implied rates volatility has risen even as Treasury yields declined. A bond rally does not necessarily imply a calmer market; investors can buy durationBond Duration: Estimates the percentage change in a bond’s price for every 1% shift in interest rates. For example, a bond with a 3-year duration will gain or lose roughly ±3% of its value if rates fall or rise by 1%. More defensively while remaining uncertain about the future path of yields. MOVE above 100 signals that rates uncertainty remains elevated.
The cross-market configuration is important. HY OAS widened 7bp to 338bp while MOVE rose to 103.31. Both measures point toward greater caution, even as benchmark Treasury yields fell.
→ The rates-volatility signal deteriorated alongside high-yield credit pricing. The Treasury rally may reflect defensive demand, but it has not been accompanied by a broad reduction in market uncertainty.
- Expected 10yr ranges (by timeframe):
-
-
| Timeframe | Low (%) | High (%) |
|---|---|---|
| 1 week | 4.86 | 5.14 |
| 1 month | 4.70 | 5.30 |
| 1 year | 3.97 | 6.03 |
Fed Policy Path Clock
A clear tension persists between the rates market and equity valuations, with the latest Treasury rally adding a potential flight-to-safety dimension.
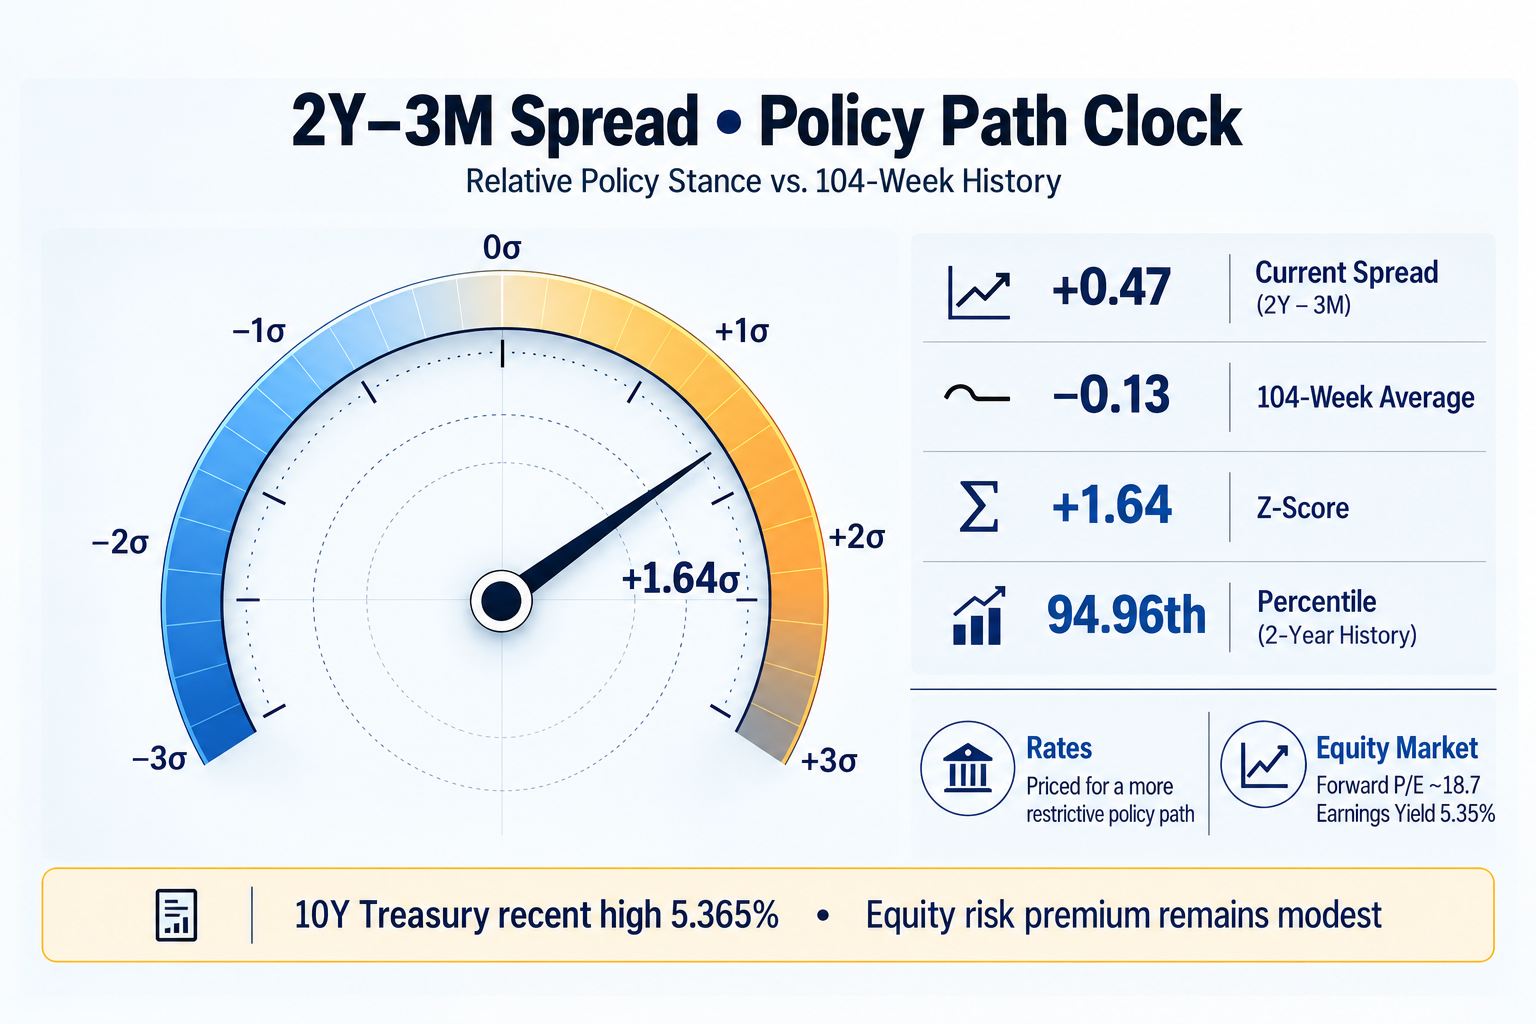
The 2Y–3M Treasury spread closed at +0.47, against a 104-week average of −0.13. Its +1.64 Z-score places it in the 94.96th percentile of the past two years. In plain terms, the spread remains unusually high relative to its recent history, consistent with a more restrictive curve configuration than the deeply inverted structure associated with expectations of monetary easing.
At the same time, longer-term Treasury yields continued to decline. The 10Y fell to 5.00% and the 30Y to 5.33%, even as FedWatch became more concentrated on a 25bp increase in December and January. The concurrent weakness in AI-related and other technology stocks makes a flight-to-safety bid a plausible explanation: investors may be seeking durationBond Duration: Estimates the percentage change in a bond’s price for every 1% shift in interest rates. For example, a bond with a 3-year duration will gain or lose roughly ±3% of its value if rates fall or rise by 1%. More as concerns about equity valuations, AI investment returns, and future growth intensify.
The cross-market evidence is consistent with greater caution. HY OAS widened 7bp to 338bp, and MOVE rose 2.21 points to 103.31. The Treasury rally therefore coincided with weaker high-yield credit pricing and higher rates volatility. This supports a defensive-market interpretation, although it does not prove that safe-haven demand was the sole driver of lower yields.
The inflation picture adds another layer. The 5Y5Y5Y5Y forward rate provides a market-implied view of where policy ultimately settles once cyclical forces dissipate. Importantly, it captures the destination of policy rather than its near-term trajectory, and should be interpreted as a structural anchor rather than a tactical signal. More forward declined 13bp to 2.20%, while the 5Y breakeven rose 11bp to 2.48%. The divergence prevents a simple conclusion that inflation concerns eased across the curve. Investors may be differentiating between nearer-term inflation compensation and longer-horizon expectations, while changes in real yields and term premiumThe "extra" return investors demand for holding a long-term bond instead of a series of short-term ones. It acts as a safety buffer, compensating the lender for the increased risk that inflation or interest rates might change unexpectedly over a longer period. More may also be contributing.
Equity valuations remain demanding. A forward P/E of 18.7 implies an earnings yield of approximately 5.35%, about 35bp above the current 10Y Treasury yield of 5.00%. The 10Y remains 50bp above the 4.50% equity valuation threshold, but it has retreated from its recent high of 5.365%. The earnings-yield comparison is not a complete equity risk-premium measure — earnings are uncertain, while equities offer potential growth that Treasury securities do not. Nevertheless, the modest premium highlights how much equity valuations depend on the durability of future earnings.
This combination is difficult to reconcile with a simple, uniformly positive growth narrative. One possibility is that investors continue to expect productivity gains—particularly from AI and related investment—to support earnings. Another is that the technology-led selloff is prompting a reassessment of how quickly those investments can generate adequate returns. The available indicators cannot determine which interpretation will ultimately prevail.
→ The central tension is between a restrictive near-term policy configuration, falling long-term Treasury yields, and equity valuations that still depend on resilient earnings. A flight-to-safety bid is plausible given the equity weakness, wider credit spreadsIn the bond market, it is the difference in yield between a corporate bond and a "risk-free" government bond of the same maturity. It represents the extra interest investors demand to compensate for the risk that a company might default. More, and higher MOVE, but it remains an interpretation rather than a proven cause. Either earnings and growth expectations will justify current valuations, or policy expectations, risk premia, and equity prices may need to adjust. The divergence warrants attention without implying that either market must adjust immediately.
Impact on Equities
Equity valuation pressure: Lower Treasury yields provide some relief, but the wider credit spreadsIn the bond market, it is the difference in yield between a corporate bond and a "risk-free" government bond of the same maturity. It represents the extra interest investors demand to compensate for the risk that a company might default. More and elevated rates volatility temper the improvement.
Normal Equity Risk Premium (ERP): the extra return investors expect for choosing stocks over “safe” Treasuries. While earnings yields provide a baseline for expected returns, the sustainability of those returns depends heavily on the composition of nominal growth.
The “quality” of the 2025 Nominal GDP was low, as the latest release of 2025 Real GDP (BEA) was only 0.48%, while inflation (GDP Price Deflator) was around 3.74%. This puts Nominal GDP (2025) at 4.24%. In other words, ~88.2% of the increase in the dollar value of the economy (Nominal GDP) in 2025 was due to higher prices. If this trend continues, then the threat of stagflationAn economic anomaly characterized by the simultaneous occurrence of stagnant growth and high unemployment alongside persistent, rising inflationary pressure. More rises. With real growth subdued and inflation doing most of the work, the quality of earnings expansion becomes a key risk for equity valuations.
Fixed-income yields remain competitive relative to equity earnings yields:
-
-
-
-
-
- 10Y Treasury: 5.00%
- 30Y Treasury: 5.33%
- Investment Grade Credit: 6.00% – 6.47%
-
-
-
-
The 10Y Treasury remains 50bp above the 4.50% valuation threshold, down from 59bp above it last week. The 9bp weekly decline eases discount-rate pressure, but the absolute yield remains elevated. The 30Y at 5.33% and investment-grade yields above 6% continue to offer substantial nominal income alternatives to equities.
A forward P/E of 18.7 implies an earnings yield of approximately 5.35%, about 35bp above the current 10Y Treasury yield. This is a modest positive spread, not a definitive measure of equity attractiveness. It does not account for earnings uncertainty, the risk of multiple compression, or the potential growth embedded in equity valuations.
The broader market signals remain cautionary. HY OAS widened to 338bp and MOVE rose to 103.31. Lower Treasury yields may reflect defensive demand amid equity-market uncertainty rather than a clean improvement in the growth outlook.
→ Bottom line: The decline in long-term yields offers marginal relief for equity valuations, but the risk backdrop remains fragile. The modest earnings-yield premium, wider high-yield spreads, and elevated rates volatility suggest that lower yields alone are insufficient to establish a more favorable equity environment.
Risk Appetite
Yield Curve Summary
| Metric | (bp) | Comment |
|---|---|---|
| 2yr - 3mo | +47 | Markets pricing in another hike — but when? |
| 10yr - 3mo | +78 | Long-term inflation persistence worries replacing recessionary risk worries. |
| 10yr - 2yr | +31 | Fairly robust signal of economic "normalization" |
| AaaAaa represents the highest rung of investment-grade corporate debt, indicating top-level creditworthiness and the lowest default risk. More - 10yr | +100 | healthy, standard spread for top-tier credit, indicating no signs of stress in the plumbing of the financial system. |
| HY-OAS | +338 | bond market is demanding a higher premium to hold riskier corporate debt relative to risk-free government bonds. — an indicator that the market's perception of credit risk, economic uncertainty, or default potential is rising. |
| MOVE Index | +103.31 | Treasury volatility is picking up. |
| 5Y5Y Forward Rate5Y5Y forward rate provides a market-implied view of where policy ultimately settles once cyclical forces dissipate. Importantly, it captures the destination of policy rather than its near-term trajectory, and should be interpreted as a structural anchor rather than a tactical signal. More | 2.20% | Fed policy remains restrictive relative to its longer-run equilibrium. |
| 5Y Breakeven Inflation Rate | 2.48% | Inflation expectations remain somewhat above target |