| Tenor / Metric | 6 Nov 2026 | 30 Oct 2026 | Weekly Δ |
|---|---|---|---|
| 3-month | 4.19% | 4.16% | +3 bp |
| 6-month | 4.23% | 4.25% | –2 bp |
| 1-year | 4.33% | 4.36% | –3 bp |
| 2-year | 4.51% | 4.56% | –5 bp |
| 5-year | 4.64% | 4.71% | –7 bp |
| 10-year | 4.86% | 4.94% | –8 bp |
| 30-year | 5.26% | 5.31% | –5 bp |
| AaaAaa represents the highest rung of investment-grade corporate debt, indicating top-level creditworthiness and the lowest default risk. More | 5.99% | 6.01% | –2 bp |
| BaaBaa represent the lowest rung of investment-grade corporate debt with moderate credit risk, making them susceptible to higher default risk than Aaa bonds. More | 6.42% | 6.47% | –5 bp |
| HY OAS | 342 bp | 344 bp | –2 bp |
| 5Y5Y5Y5Y forward rate provides a market-implied view of where policy ultimately settles once cyclical forces dissipate. Importantly, it captures the destination of policy rather than its near-term trajectory, and should be interpreted as a structural anchor rather than a tactical signal. More Forward | 2.17% | 2.22% | –5 bp |
| 5Y Breakeven | 2.29% | 2.46% | –17 bp |
| MOVE IndexThe ICE Bank of America U.S. Bond Market Option Volatility Estimate (MOVE) Index measures implied volatility of U.S. Treasury yields, derived from options on Treasuries (primarily 2Y–30Y maturities). It’s commonly called the “VIX for bonds”, but more precisely, it reflects the market’s expectation of how much Treasury yields will move, not bond prices. It is a critical cross-asset signal. More | 92.77 | 100.20 | –7.43 |
Executive Summary
CONTINUED RALLY | INTERMEDIATE-LED DECLINE | INFLATION COMPENSATION EASES WHILE HY OAS REMAINS ELEVATED
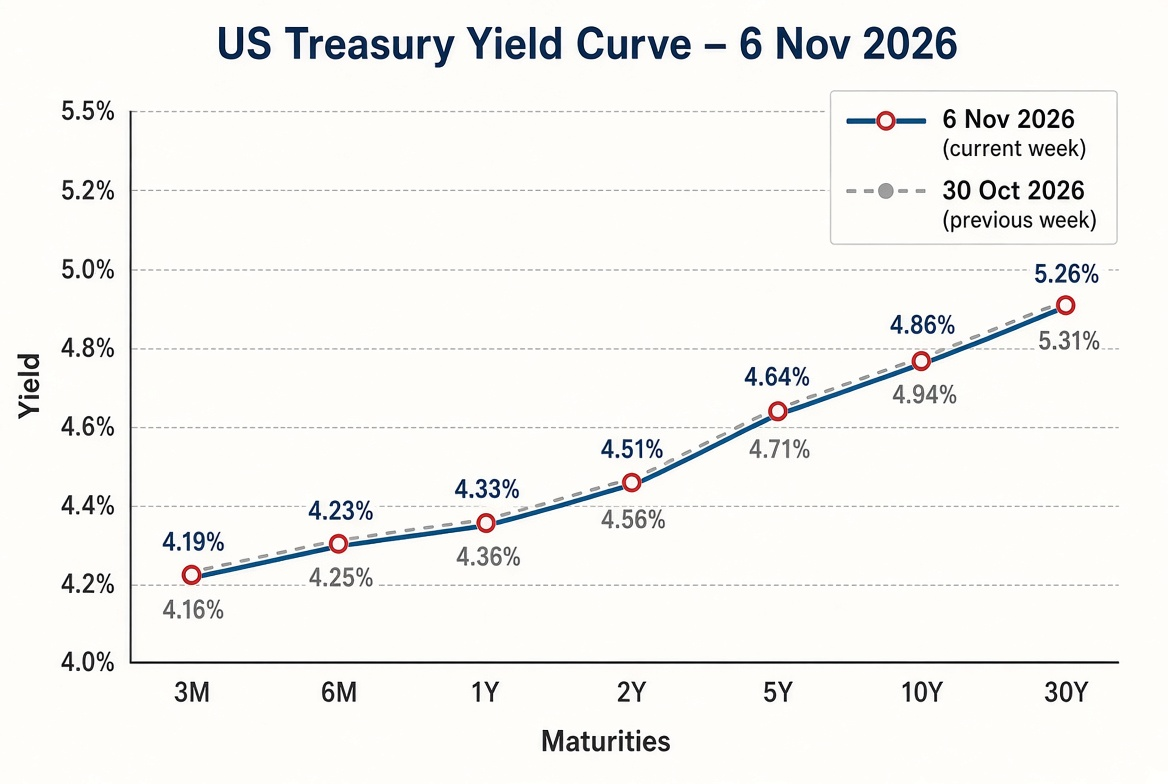
Treasury yields declined across most of the curve, led by the 5Y–10Y sector (5Y –7 bp to 4.64%, 10Y –8 bp to 4.86%). The 30Y fell 5 bp to 5.26% while the 3-month edged higher. The move produced a modest flattening relative to the prior week’s steepener. Key spreads: 10Y–3M narrowed 11 bp to +67 bp while 30Y–2Y held near +75 bp. FedWatch probabilities remained tilted toward further tightening, with December still concentrated on a +25 bp outcome. Cross-market signals improved modestly on rates volatility, but high-yield spreads stayed well above 300 bp.
Central tension: Broad yield decline and easing inflation compensation alongside persistently elevated high-yield risk pricing.
Curve Decomposition (Front | Belly | Long)
-
-
- Front end (3M–1Y)
3M 4.19% (+3 bp), 6M 4.23% (–2 bp), 1Y 4.33% (–3 bp).
Mixed. The 3-month rose while longer short-end maturities eased, consistent with FedWatch still pricing a high probability of a December hike. - Belly (2Y–5Y)
2Y 4.51% (–5 bp), 5Y 4.64% (–7 bp).
Solid performance. Intermediate yields continued to decline, extending the prior week’s front-end relief. - Long end (10Y–30Y)
10Y 4.86% (–8 bp), 30Y 5.26% (–5 bp).
The 10Y led the weekly decline. It now sits 36 bp above the 4.50% equity-valuation threshold (improved from 44 bp) and remains well below the recent high of 5.365%.
- Front end (3M–1Y)
-
Geometry: Modest bull flatteningA bull flattener is a yield curve shift where long-term bond yields fall faster than short-term yields, flattening the curve. It is "bullish" for bond prices—particularly long-duration bonds—and often signals investor fear of an economic slowdown, acting as a "flight to safety". More relative to the prior week. The larger decline in the 10Y versus the 2Y and 30Y narrowed the 10Y–3M spread while the 30Y–2Y held steady.
Policy Path & Inflation Compensation
FedWatch distributions remained consistent with further tightening:
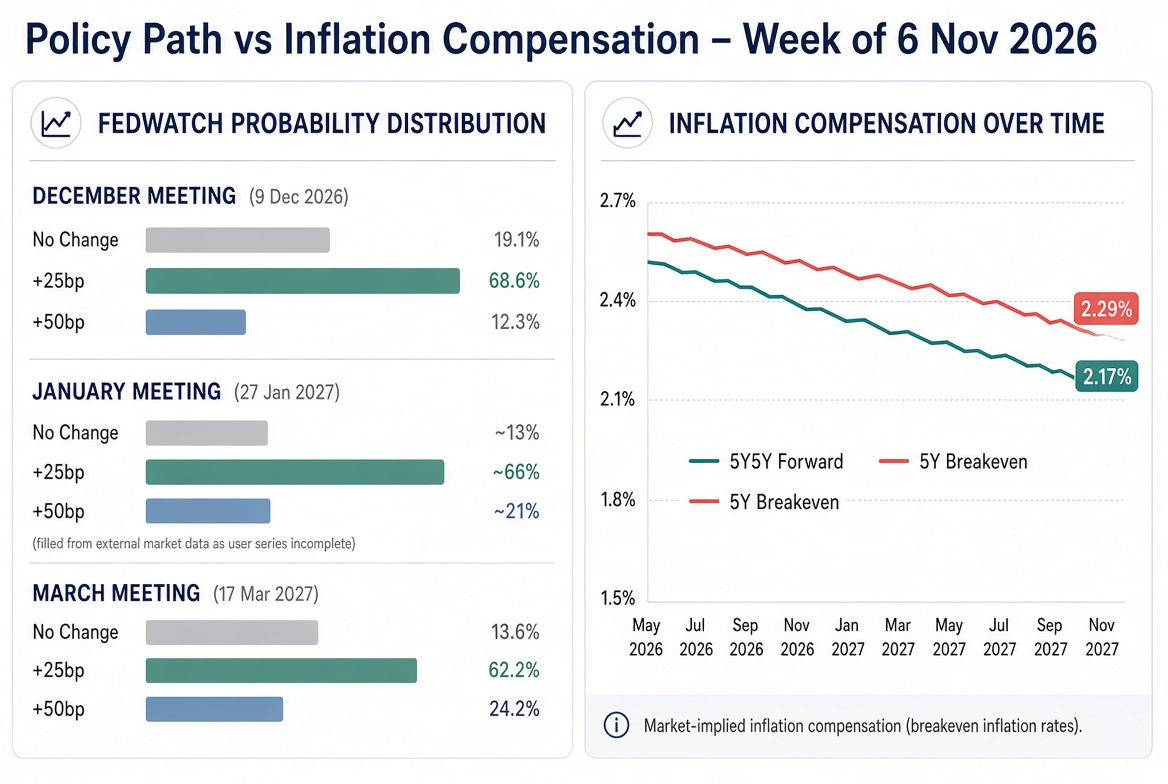
- December 9: No Change 19.14% | +25 bp 68.57% | +50 bp 12.28%
- January 27: No Change ~13% | +25 bp ~66% | +50 bp ~21%
- March 17: No Change 13.61% | +25 bp 62.20% | +50 bp 24.19%
The path continues to favor incremental hikes, with December still the highest-conviction near-term meeting. Inflation compensation declined: the 5Y5Y5Y5Y forward rate provides a market-implied view of where policy ultimately settles once cyclical forces dissipate. Importantly, it captures the destination of policy rather than its near-term trajectory, and should be interpreted as a structural anchor rather than a tactical signal. More forward fell 5 bp to 2.17% and the 5Y breakeven dropped 17 bp to 2.29%. The sharper move in the breakeven suggests a reduction in near-term inflation risk premia alongside the nominal yield decline.
Policy Path Clock
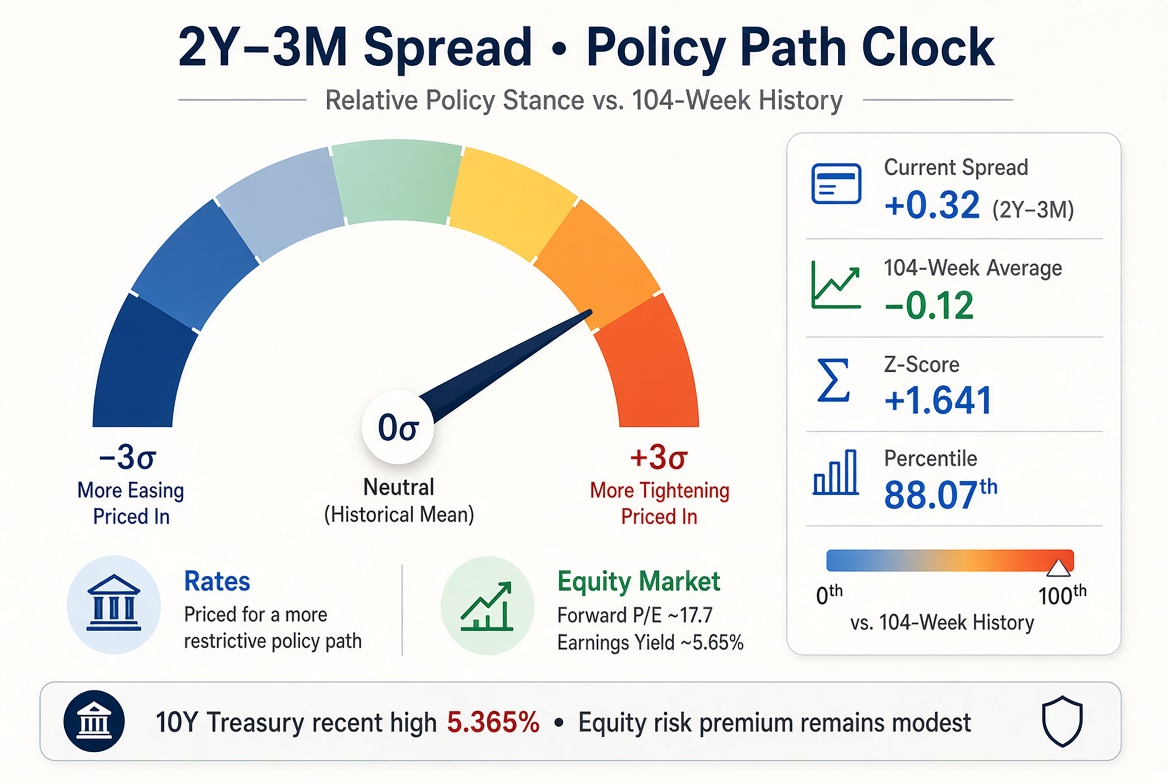
Current 2Y–3M spread: +0.32 (104-week average –0.12; Z-score +1.641; 88.07th percentile).
The spread has narrowed further from the prior week’s +0.40 but remains elevated relative to its two-year history, consistent with a still-restrictive near-term policy configuration.
Cross-Market Risk Dashboard
| Signal | Level / Change | Reading |
|---|---|---|
| HY OAS | 342 bp (–2 bp) | Still well above 300 bp — elevated and a point of concern |
| Baa–AaaAaa represents the highest rung of investment-grade corporate debt, indicating top-level creditworthiness and the lowest default risk. More spread | 43 bp (–3 bp) | Modest tightening (IG resilient) |
| MOVE IndexThe ICE Bank of America U.S. Bond Market Option Volatility Estimate (MOVE) Index measures implied volatility of U.S. Treasury yields, derived from options on Treasuries (primarily 2Y–30Y maturities). It’s commonly called the “VIX for bonds”, but more precisely, it reflects the market’s expectation of how much Treasury yields will move, not bond prices. It is a critical cross-asset signal. More | 92.77 (–7.43) | Notable decline |
| 10Y / 5Y | –8 / –7 bp | Intermediate-led |
The ICE BofA U.S. Bond Market Option Volatility Estimate (MOVE) Index is the primary gauge of expected volatility in the U.S. Treasury market. Often called the "VIX for bonds," it measures market sentiment and interest rate risk by tracking the implied volatility of U.S. Treasury options.
| Date | bp |
|---|---|
| 1/3/2020 | 60.12 |
| 1/10/2020 | 60.12 |
| 1/17/2020 | 53.32 |
| 1/24/2020 | 49.67 |
| 1/31/2020 | 59.94 |
| 2/7/2020 | 72.98 |
| 2/14/2020 | 65.59 |
| 2/21/2020 | 62.38 |
| 2/28/2020 | 74.54 |
| 3/6/2020 | 109.67 |
| 3/13/2020 | 125.21 |
| 3/20/2020 | 138.4 |
| 3/27/2020 | 133.37 |
| 4/3/2020 | 88.33 |
| 4/10/2020 | 65.01 |
| 4/17/2020 | 74.39 |
| 4/24/2020 | 69.84 |
| 5/1/2020 | 66.09 |
| 5/8/2020 | 48.11 |
| 5/15/2020 | 57.4 |
| 5/22/2020 | 56.53 |
| 5/29/2020 | 51.67 |
| 6/5/2020 | 51.55 |
| 6/12/2020 | 61.97 |
| 6/19/2020 | 55.81 |
| 6/26/2020 | 53.45 |
| 7/3/2020 | 51.21 |
| 7/10/2020 | 50.96 |
| 7/17/2020 | 49.19 |
| 7/24/2020 | 45.68 |
| 7/31/2020 | 42.48 |
| 8/7/2020 | 41.98 |
| 8/14/2020 | 41.46 |
| 8/21/2020 | 43.09 |
| 8/28/2020 | 45.14 |
| 9/4/2020 | 48.19 |
| 9/11/2020 | 47.04 |
| 9/18/2020 | 43.12 |
| 9/25/2020 | 37.24 |
| 10/2/2020 | 36.97 |
| 10/9/2020 | 39.97 |
| 10/16/2020 | 57.52 |
| 10/23/2020 | 57.25 |
| 10/30/2020 | 58.46 |
| 11/6/2020 | 61.91 |
| 11/13/2020 | 39.88 |
| 11/20/2020 | 42.95 |
| 11/27/2020 | 42.31 |
| 12/4/2020 | 39.64 |
| 12/11/2020 | 43.89 |
| 12/18/2020 | 47.52 |
| 12/25/2020 | 44.64 |
| 1/1/2021 | 42.11 |
| 1/8/2021 | 48.98 |
| 1/15/2021 | 44.81 |
| 1/22/2021 | 45.14 |
| 1/29/2021 | 43.09 |
| 2/5/2021 | 47.41 |
| 2/12/2021 | 47.2 |
| 2/19/2021 | 47.01 |
| 2/26/2021 | 60.43 |
| 3/5/2021 | 75.66 |
| 3/12/2021 | 69.37 |
| 3/19/2021 | 70.83 |
| 3/26/2021 | 68.8 |
| 4/2/2021 | 61.49 |
| 4/9/2021 | 63.71 |
| 4/16/2021 | 61.21 |
| 4/23/2021 | 62.57 |
| 4/30/2021 | 59.98 |
| 5/7/2021 | 58.13 |
| 5/14/2021 | 54.13 |
| 5/21/2021 | 54.99 |
| 5/28/2021 | 54.59 |
| 6/4/2021 | 52.04 |
| 6/11/2021 | 49.78 |
| 6/18/2021 | 50.85 |
| 6/25/2021 | 60.45 |
| 7/2/2021 | 55.58 |
| 7/9/2021 | 52.41 |
| 7/16/2021 | 59.92 |
| 7/23/2021 | 58.24 |
| 7/30/2021 | 65.28 |
| 8/6/2021 | 61.19 |
| 8/13/2021 | 62.64 |
| 8/20/2021 | 55.45 |
| 8/27/2021 | 59.95 |
| 9/3/2021 | 57.98 |
| 9/10/2021 | 53.26 |
| 9/17/2021 | 51.73 |
| 9/24/2021 | 56.06 |
| 10/1/2021 | 58.46 |
| 10/8/2021 | 57.38 |
| 10/15/2021 | 59.65 |
| 10/22/2021 | 62.7 |
| 10/29/2021 | 72.04 |
| 11/5/2021 | 75.45 |
| 11/12/2021 | 66.9 |
| 11/19/2021 | 78.61 |
| 11/26/2021 | 73.39 |
| 12/3/2021 | 89.45 |
| 12/10/2021 | 79.14 |
| 12/17/2021 | 74.36 |
| 12/24/2021 | 72.46 |
| 12/31/2021 | 77.29 |
| 1/7/2022 | 77.1 |
| 1/14/2022 | 74.69 |
| 1/21/2022 | 76.59 |
| 1/28/2022 | 81.03 |
| 2/4/2022 | 85.29 |
| 2/11/2022 | 87.68 |
| 2/18/2022 | 94.03 |
| 2/25/2022 | 94.36 |
| 3/4/2022 | 93.34 |
| 3/11/2022 | 131.82 |
| 3/18/2022 | 99.03 |
| 3/25/2022 | 91.77 |
| 4/1/2022 | 125.27 |
| 4/8/2022 | 108.34 |
| 4/15/2022 | 124.86 |
| 4/22/2022 | 119.66 |
| 4/29/2022 | 128.12 |
| 5/6/2022 | 128.4 |
| 5/13/2022 | 121.42 |
| 5/20/2022 | 114.61 |
| 5/27/2022 | 111.1 |
| 6/3/2022 | 98.48 |
| 6/10/2022 | 97.73 |
| 6/17/2022 | 114.23 |
| 6/24/2022 | 133.75 |
| 7/1/2022 | 127 |
| 7/8/2022 | 144.17 |
| 7/15/2022 | 145.25 |
| 7/22/2022 | 129.85 |
| 7/29/2022 | 123.7 |
| 8/5/2022 | 116.36 |
| 8/12/2022 | 122.58 |
| 8/19/2022 | 106.28 |
| 8/26/2022 | 123.81 |
| 9/2/2022 | 122.95 |
| 9/9/2022 | 120.72 |
| 9/16/2022 | 121.54 |
| 9/23/2022 | 124.95 |
| 9/30/2022 | 137.28 |
| 10/7/2022 | 141.89 |
| 10/14/2022 | 148.46 |
| 10/21/2022 | 152.89 |
| 10/28/2022 | 156.95 |
| 11/4/2022 | 144.6 |
| 11/11/2022 | 128.44 |
| 11/18/2022 | 111.69 |
| 11/25/2022 | 129.33 |
| 12/2/2022 | 129.6 |
| 12/9/2022 | 118.62 |
| 12/16/2022 | 132.79 |
| 12/23/2022 | 113.65 |
| 12/30/2022 | 113.17 |
| 1/6/2023 | 121.61 |
| 1/13/2023 | 113.87 |
| 1/20/2023 | 113.55 |
| 1/27/2023 | 114.76 |
| 2/3/2023 | 100.7 |
| 2/10/2023 | 98.99 |
| 2/17/2023 | 109.63 |
| 2/24/2023 | 110.11 |
| 3/3/2023 | 122.84 |
| 3/10/2023 | 122.52 |
| 3/17/2023 | 140.06 |
| 3/24/2023 | 180.11 |
| 3/31/2023 | 173.66 |
| 4/7/2023 | 135.93 |
| 4/14/2023 | 139.2 |
| 4/21/2023 | 118.84 |
| 4/28/2023 | 120.84 |
| 5/5/2023 | 122.46 |
| 5/12/2023 | 130.21 |
| 5/19/2023 | 120.52 |
| 5/26/2023 | 127.51 |
| 6/2/2023 | 145.37 |
| 6/9/2023 | 120.95 |
| 6/16/2023 | 115.77 |
| 6/23/2023 | 104.43 |
| 6/30/2023 | 105.74 |
| 7/7/2023 | 110.64 |
| 7/14/2023 | 130.41 |
| 7/21/2023 | 112.48 |
| 7/28/2023 | 106.66 |
| 8/4/2023 | 109.76 |
| 8/11/2023 | 115.91 |
| 8/18/2023 | 112.13 |
| 8/25/2023 | 120.51 |
| 9/1/2023 | 110.37 |
| 9/8/2023 | 102.92 |
| 9/15/2023 | 104.34 |
| 9/22/2023 | 96.61 |
| 9/29/2023 | 101.11 |
| 10/6/2023 | 113.55 |
| 10/13/2023 | 126.64 |
| 10/20/2023 | 128.33 |
| 10/27/2023 | 135.45 |
| 11/3/2023 | 129.16 |
| 11/10/2023 | 118.74 |
| 11/17/2023 | 116.79 |
| 11/24/2023 | 113.11 |
| 12/1/2023 | 107.43 |
| 12/8/2023 | 111.51 |
| 12/15/2023 | 121.65 |
| 12/22/2023 | 115.75 |
| 12/29/2023 | 111.38 |
| 1/5/2024 | 114.62 |
| 1/12/2024 | 116.19 |
| 1/19/2024 | 106.51 |
| 1/26/2024 | 104.97 |
| 2/2/2024 | 100.23 |
| 2/9/2024 | 106.72 |
| 2/16/2024 | 106.21 |
| 2/23/2024 | 109.2 |
| 3/1/2024 | 108.31 |
| 3/8/2024 | 106.48 |
| 3/15/2024 | 100.88 |
| 3/22/2024 | 97.82 |
| 3/29/2024 | 91.04 |
| 4/5/2024 | 86.38 |
| 4/12/2024 | 94.31 |
| 4/19/2024 | 112.82 |
| 4/26/2024 | 111.26 |
| 5/3/2024 | 104.4 |
| 5/10/2024 | 95.96 |
| 5/17/2024 | 94.23 |
| 5/24/2024 | 89.35 |
| 5/31/2024 | 83.57 |
| 6/7/2024 | 91.14 |
| 6/14/2024 | 91.82 |
| 6/21/2024 | 100.16 |
| 6/28/2024 | 94.09 |
| 7/5/2024 | 98.59 |
| 7/12/2024 | 98.78 |
| 7/19/2024 | 86.79 |
| 7/26/2024 | 94.29 |
| 8/2/2024 | 97.76 |
| 8/9/2024 | 112.26 |
| 8/16/2024 | 108.26 |
| 8/23/2024 | 102.81 |
| 8/30/2024 | 105.63 |
| 9/6/2024 | 107.77 |
| 9/13/2024 | 107.24 |
| 9/20/2024 | 100.6 |
| 9/27/2024 | 91 |
| 10/4/2024 | 92.53 |
| 10/11/2024 | 100.15 |
| 10/18/2024 | 118.47 |
| 10/25/2024 | 123.13 |
| 11/1/2024 | 128.4 |
| 11/8/2024 | 132.58 |
| 11/15/2024 | 99.85 |
| 11/22/2024 | 102.47 |
| 11/29/2024 | 99.14 |
| 12/6/2024 | 95.22 |
| 12/13/2024 | 83.2 |
| 12/20/2024 | 85.66 |
| 12/27/2024 | 91.75 |
| 1/3/2025 | 94.8 |
| 1/10/2025 | 93.35 |
| 1/17/2025 | 96.57 |
| 1/24/2025 | 95.6 |
| 1/31/2025 | 86.75 |
| 2/7/2025 | 91.76 |
| 2/14/2025 | 93.13 |
| 2/21/2025 | 84.67 |
| 2/28/2025 | 91.83 |
| 3/7/2025 | 104.46 |
| 3/14/2025 | 104.41 |
| 3/21/2025 | 101.01 |
| 3/28/2025 | 94.54 |
| 4/4/2025 | 96.83 |
| 4/11/2025 | 125.71 |
| 4/18/2025 | 137.26 |
| 4/25/2025 | 114.64 |
| 5/2/2025 | 105.79 |
| 5/9/2025 | 101.4 |
| 5/16/2025 | 100.4 |
| 5/23/2025 | 96.7 |
| 5/30/2025 | 100.91 |
| 6/6/2025 | 92.11 |
| 6/13/2025 | 89.65 |
| 6/20/2025 | 95.31 |
| 6/27/2025 | 90.1 |
| 7/4/2025 | 87.93 |
| 7/11/2025 | 86.09 |
| 7/18/2025 | 85.48 |
| 7/25/2025 | 83.29 |
| 8/1/2025 | 82.09 |
| 8/8/2025 | 83.83 |
| 8/15/2025 | 79.2 |
| 8/22/2025 | 76.66 |
| 8/29/2025 | 78.1 |
| 9/5/2025 | 79.39 |
| 9/12/2025 | 85.29 |
| 9/19/2025 | 73.37 |
| 9/26/2025 | 72.51 |
| 10/3/2025 | 74.38 |
| 10/10/2025 | 69.53 |
| 10/17/2025 | 81.65 |
| 10/24/2025 | 78.62 |
| 10/31/2025 | 68.94 |
| 11/7/2025 | 66.61 |
| 11/14/2025 | 74.41 |
| 11/21/2025 | 79.71 |
| 11/28/2025 | 78.81 |
| 12/5/2025 | 68.95 |
| 12/12/2025 | 67.28 |
| 12/19/2025 | 69.25 |
| 12/26/2025 | 59.41 |
| 1/2/2026 | 58.5 |
| 1/9/2026 | 62.36 |
| 1/16/2026 | 61.55 |
| 1/23/2026 | 58.05 |
| 1/30/2026 | 56.25 |
| 2/6/2026 | 59.2 |
| 2/13/2026 | 63.62 |
| 2/20/2026 | 70.1 |
| 2/27/2026 | 64.27 |
| 3/6/2026 | 73.38 |
| 3/13/2026 | 81.26 |
| 3/20/2026 | 91.17 |
| 3/27/2026 | 108.84 |
| 4/3/2026 | 111.95 |
| 4/10/2026 | 81.78 |
| 4/17/2026 | 72.15 |
| 4./24/2026 | 65.7 |
| 5/1/2026 | 66.97 |
| 5/8/2026 | 70.41 |
| 5/15/2026 | 67.25 |
| 5/22/2026 | 79.87 |
| 5/29/2026 | 78.43 |
| 6/5/2026 | 70.22 |
| 6/12/2026 | 75.2 |
| 6/19/2026 | 69.36 |
| 6/26/2026 | 65.39 |
| 7/3/2026 | 66.79 |
| 7/10/2026 | 65.4 |
| 7/17/2026 | 69.55 |
| 7/24/2026 | 70.88 |
| 7/31/2026 | 76.82 |
| 8/7/2026 | 83.02 |
| 8/14/2026 | 72.03 |
| 8/21/2026 | 69.58 |
| 8/28/2026 | 73.4 |
| 9/4/2026 | 70.97 |
| 9/11/2026 | 73.1 |
| 9/18/2026 | 82.21 |
| 9/25/2026 | 80.64 |
| 10/2/2026 | 96 |
| 10/9/2026 | 107.29 |
| 10/16/2026 | 98.47 |
| 10/23/2026 | 101.1 |
| 10/30/2026 | 103.31 |
| 11/6/2026 | 100.2 |
| 11/13/2026 | 92.77 |
High-yield spreads remain materially above 300 bp even after a small weekly decline. This level continues to warrant caution and is not yet consistent with a broad improvement in credit risk appetite. MOVE’s drop below 100 is a constructive development for rates volatility.
Expected 10yr ranges (by timeframe):
| Timeframe | Low (%) | High (%) |
|---|---|---|
| 1 week | 4.73 | 4.99 |
| 1 month | 4.59 | 5.13 |
| 1 year | 3.93 | 5.79 |
Implications & Positioning Lens
The continued decline in intermediate and long-end yields further eases discount-rate pressure. The 10Y at 4.86% is now only 36 bp above the 4.50% equity threshold. A forward P/E of 17.7 implies an earnings yield of approximately 5.65%, a wider premium over the 10Y than the prior week.
However, HY OAS at 342 bp remains a clear point of concern — well above 300 bp and only marginally improved from last week’s 344 bp. The combination of lower inflation compensation, reduced rates volatility, and still-elevated high-yield spreads supports selective quality durationBond Duration: Estimates the percentage change in a bond’s price for every 1% shift in interest rates. For example, a bond with a 3-year duration will gain or lose roughly ±3% of its value if rates fall or rise by 1%. More while keeping credit risk elevated.
Bottom Line
- Primary signal: Continued yield decline led by the 5Y–10Y sector, with modest flattening versus the prior week.
- Policy: FedWatch continues to price further tightening, with December still concentrated on a +25 bp hike.
- Risk: HY OAS remains well above 300 bp and is a persistent point of concern despite a small weekly decline; MOVE improved meaningfully.
- Unresolved: Whether the decline in inflation compensation and rates volatility will be sustained if high-yield spreads stay elevated.
Positioning bias: quality durationBond Duration: Estimates the percentage change in a bond’s price for every 1% shift in interest rates. For example, a bond with a 3-year duration will gain or lose roughly ±3% of its value if rates fall or rise by 1%. More remains supported by lower intermediate yields and easing inflation compensation, but high-yield credit continues to require caution while spreads stay above 300 bp.
Summary Cheat-Sheet Table
| Metric | 6 Nov 2026 | Signal |
|---|---|---|
| Curve regime | Modest bull flatten | Intermediate-led |
| 10Y–3M spread | +67 bp | Narrowed |
| 30Y–2Y spread | +75 bp | Stable |
| 10Y vs 4.50% threshold | +36 bp | Improved |
| FedWatch Dec meeting | ~69% +25 bp | Still concentrated |
| HY OAS | 342 bp | Elevated (>300 bp) — concern |
| MOVE | 92.77 | Improved |
| 5Y5Y5Y5Y forward rate provides a market-implied view of where policy ultimately settles once cyclical forces dissipate. Importantly, it captures the destination of policy rather than its near-term trajectory, and should be interpreted as a structural anchor rather than a tactical signal. More / 5Y BEI | 2.17% / 2.29% | Both lower |
Yield Curve Data
| Date | 3-mth | 6-mth | 1-yr | 2-yr | 5-yr | 10-yr | 30-yr | AaaAaa represents the highest rung of investment-grade corporate debt, indicating top-level creditworthiness and the lowest default risk. More | BaaBaa represent the lowest rung of investment-grade corporate debt with moderate credit risk, making them susceptible to higher default risk than Aaa bonds. More | HY-OAS | 5Y5Y5Y5Y forward rate provides a market-implied view of where policy ultimately settles once cyclical forces dissipate. Importantly, it captures the destination of policy rather than its near-term trajectory, and should be interpreted as a structural anchor rather than a tactical signal. More Forward | 5Y Breakeven Inflation | MOVE IndexThe ICE Bank of America U.S. Bond Market Option Volatility Estimate (MOVE) Index measures implied volatility of U.S. Treasury yields, derived from options on Treasuries (primarily 2Y–30Y maturities). It’s commonly called the “VIX for bonds”, but more precisely, it reflects the market’s expectation of how much Treasury yields will move, not bond prices. It is a critical cross-asset signal. More | |
|---|---|---|---|---|---|---|---|---|---|---|---|---|---|---|
| 11/6/2026 | 4.19 | 4.23 | 4.33 | 4.51 | 4.64 | 4.86 | 5.26 | 5.99 | 6.42 | 3.42 | 2.17 | 2.29 | 92.77 | |
| 10/30/2026 | 4.16 | 4.25 | 4.36 | 4.56 | 4.71 | 4.94 | 5.31 | 6.01 | 6.47 | 3.44 | 2.22 | 2.46 | 100.20 | |
| 10/23/2026 | 4.22 | 4.30 | 4.44 | 4.69 | 4.82 | 5.00 | 5.33 | 6 | 6.47 | 3.38 | 2.2 | 2.48 | 103.31 | |
| 10/16/2026 | 4.26 | 4.34 | 4.46 | 4.74 | 4.89 | 5.09 | 5.43 | 6.06 | 6.55 | 3.31 | 2.33 | 2.37 | 101.10 | |
| 10/9/2026 | 4.25 | 4.32 | 4.47 | 4.80 | 5.02 | 5.24 | 5.60 | 6.22 | 6.69 | 3.11 | 2.32 | 2.34 | 98.47 | |
| 10/2/2026 | 4.19 | 4.27 | 4.46 | 4.83 | 5.06 | 5.28 | 5.63 | 6.28 | 6.75 | 3.10 | 2.35 | 2.37 | 107.29 | |
| 9/25/2026 | 4.24 | 4.33 | 4.50 | 4.81 | 4.98 | 5.17 | 5.49 | 6.18 | 6.63 | 2.93 | 2.34 | 2.34 | 96.00 | |
| 9/18/2026 | 4.14 | 4.24 | 4.44 | 4.76 | 4.86 | 5.01 | 5.34 | 5.98 | 6.41 | 2.68 | 2.35 | 2.31 | 80.64 | |
| 9/11/2026 | 4.07 | 4.12 | 4.35 | 4.63 | 4.78 | 4.96 | 5.35 | 6.03 | 6.46 | 2.65 | 2.32 | 2.4 | 82.21 | |
| 9/4/2026 | 3.91 | 3.98 | 4.13 | 4.37 | 4.54 | 4.78 | 5.24 | 5.92 | 6.34 | 2.68 | 2.33 | 2.37 | 73.1 | |
| 8/28/2026 | 3.90 | 4.02 | 4.15 | 4.34 | 4.48 | 4.73 | 5.22 | 5.86 | 6.27 | 2.60 | 2.32 | 2.3 | 70.97 | |
| 8/21/2026 | 3.88 | 3.95 | 4.03 | 4.24 | 4.43 | 4.74 | 5.27 | 5.92 | 6.37 | 2.70 | 2.34 | 2.34 | 73.4 | |
| 8/14/2026 | 3.86 | 3.95 | 3.98 | 4.17 | 4.36 | 4.68 | 5.25 | 5.92 | 6.37 | 2.67 | 2.3 | 2.24 | 69.58 | |
| 8/7/2026 | 3.87 | 3.96 | 4.01 | 4.19 | 4.35 | 4.65 | 5.19 | 5.85 | 6.29 | 2.7 | 2.28 | 2.22 | 72.03 | |
| 7/31/2026 | 3.83 | 3.98 | 4.08 | 4.28 | 4.45 | 4.75 | 5.27 | 5.96 | 6.38 | 2.84 | 2.3 | 2.26 | 83.02 | |
| 7/24/2026 | 3.96 | 4.08 | 4.14 | 4.33 | 4.43 | 4.69 | 5.16 | 5.87 | 6.28 | 2.79 | 2.28 | 2.24 | 76.82 | |
| 7/17/2026 | 3.85 | 3.96 | 4.01 | 4.18 | 4.28 | 4.55 | 5.06 | 5.72 | 6.14 | 2.73 | 2.21 | 2.27 | 70.88 | |
| 7/10/2026 | 3.85 | 3.99 | 4.06 | 4.21 | 4.30 | 4.56 | 5.06 | 5.72 | 6.14 | 2.69 | 2.2 | 2.28 | 69.55 | |
| 7/3/2026 | 3.82 | 3.98 | 3.96 | 4.14 | 4.23 | 4.49 | 4.98 | 5.6 | 6.02 | 2.74 | 2.22 | 2.24 | 65.4 | |
| 6/26/2026 | 3.83 | 3.94 | 3.94 | 4.07 | 4.12 | 4.38 | 4.87 | 5.5 | 5.94 | 2.83 | 2.19 | 2.21 | 66.79 | |
| 6/19/2026 | 3.83 | 3.92 | 4.00 | 4.19 | 4.23 | 4.46 | 4.90 | 5.5 | 5.97 | 2.66 | 2.23 | 2.27 | 65.39 | |
| 6/12/2026 | 3.78 | 3.82 | 3.86 | 4.09 | 4.21 | 4.48 | 4.97 | 5.52 | 6.01 | 2.71 | 2.23 | 2.39 | 69.36 | |
| 6/5/2026 | 3.78 | 3.81 | 3.88 | 4.17 | 4.29 | 4.55 | 5.01 | 5.53 | 6.06 | 2.76 | 2.24 | 2.48 | 75.2 | |
| 5/29/2026 | 3.69 | 3.78 | 3.79 | 3.98 | 4.13 | 4.45 | 4.99 | 5.5 | 6.02 | 2.72 | 2.24 | 2.52 | 70.22 | |
| 5/22/2026 | 3.68 | 3.79 | 3.86 | 4.13 | 4.27 | 4.56 | 5.07 | 5.61 | 6.13 | 2.74 | 2.26 | 2.54 | 78.43 | |
| 5/15/2026 | 3.69 | 3.77 | 3.82 | 4.09 | 4.26 | 4.59 | 5.12 | 5.65 | 6.21 | 2.80 | 2.28 | 2.7 | 79.87 | |
| 5/8/2026 | 3.69 | 3.74 | 3.75 | 3.90 | 4.02 | 4.38 | 4.95 | 5.47 | 6.03 | 2.81 | 2.28 | 2.62 | 67.25 | |
| 5/1/2026 | 3.68 | 3.71 | 3.73 | 3.88 | 4.02 | 4.39 | 4.97 | 5.49 | 6.08 | 2.77 | 2.27 | 2.69 | 70.41 | |
| 4/24/2026 | 3.69 | 3.71 | 3.67 | 3.78 | 3.92 | 4.31 | 4.91 | 5.41 | 6.01 | 2.86 | 2.23 | 2.61 | 66.97 | |
| 4/17/2026 | 3.70 | 3.69 | 3.64 | 3.71 | 3.84 | 4.26 | 4.88 | 5.36 | 5.98 | 2.83 | 2.16 | 2.56 | 65.7 | |
| 4/10/2026 | 3.69 | 3.72 | 3.70 | 3.81 | 3.94 | 4.31 | 4.91 | 5.42 | 6.03 | 2.94 | 2.14 | 2.58 | 72.15 | |
| 4/3/2026 | 3.71 | 3.73 | 3.72 | 3.84 | 3.99 | 4.35 | 4.91 | 5.44 | 6.05 | 3.13 | 2.11 | 2.61 | 81.78 | |
| 3/27/2026 | 3.73 | 3.75 | 3.77 | 3.88 | 4.06 | 4.44 | 4.98 | 5.66 | 6.22 | 3.42 | 2.06 | 2.56 | 111.95 | |
| 3/20/2026 | 3.74 | 3.79 | 3.80 | 3.88 | 4.01 | 4.39 | 4.96 | 5.61 | 6.18 | 3.24 | 2.13 | 2.63 | 108.84 | |
| 3/13/2026 | 3.72 | 3.70 | 3.66 | 3.73 | 3.87 | 4.28 | 4.90 | 5.60 | 6.11 | 3.28 | 2.11 | 2.61 | 91.17 | |
| 3/6/2026 | 3.71 | 3.68 | 3.56 | 3.53 | 3.67 | 4.10 | 4.73 | 5.32 | 5.86 | 3.13 | 2.14 | 2.56 | 81.26 | |
| 2/27/2026 | 3.68 | 3.61 | 3.48 | 3.42 | 3.58 | 4.02 | 4.64 | 5.25 | 5.77 | 3.10 | 2.1 | 2.40 | 73.38 | |
| 2/20/2026 | 3.69 | 3.60 | 3.51 | 3.46 | 3.65 | 4.08 | 4.72 | 5.25 | 5.76 | 2.86 | 2.13 | 2.43 | 64.27 | |
| 2/13/2026 | 3.68 | 3.59 | 3.42 | 3.40 | 3.61 | 4.04 | 4.69 | 5.31 | 5.81 | 2.95 | 2.12 | 2.42 | 70.1 | |
| 2/6/2026 | 3.68 | 3.59 | 3.45 | 3.54 | 3.80 | 4.26 | 4.85 | 5.40 | 5.90 | 2.87 | 2.18 | 2.50 | 63.62 | |
| 1/30/2026 | 3.67 | 3.61 | 3.48 | 3.54 | 3.81 | 4.24 | 4.87 | 5.35 | 5.86 | 2.80 | 2.19 | 2.53 | 59.2 |
Source: Federal Reserve Economic Data (FRED) is an online database created and maintained by the Research Department at the Federal Reserve Bank of St. Louis