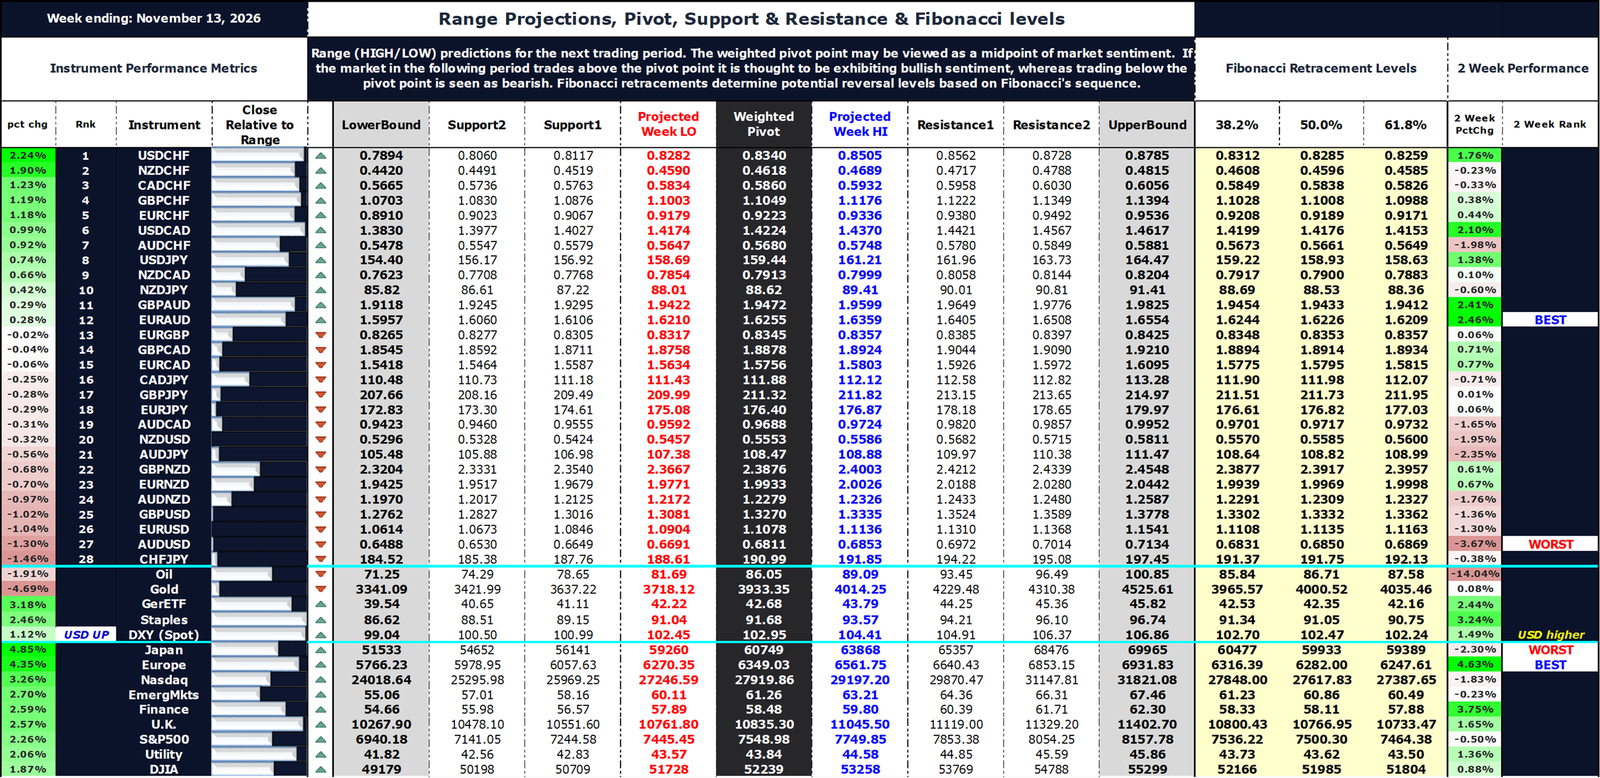
Market review and metrics for FX, Oil, Gold, Sectors & Global Indices. Pivot points, Support, Resistance & Fibonacci Reversal levels and Chart of Interest.
Global markets overview
Strongest to Weakest
| USD | NZD | JPY | CAD | GBP | EUR | AUD | CHF |
|---|
| Market | Best Performer | Worst Performer |
|---|---|---|
| FX | USDCHF | CHFJPY |
| Global Index / Sector | Japan | Gold |
Commentary
FX
The US dollar (USD) finished as the strongest major for the week ending November 13, 2026, while the Swiss franc (CHF) was the clear laggard. Relative performance across the 28 pairs showed USD at the top of the strength ranking, followed by NZD and JPY. CHF’s sharp underperformance (roughly –10% relative) stood out against a more mixed backdrop for the rest of the majors.
Pairs involving CHF on the short side dominated the top of the performance table (USDCHF +2.24%, NZDCHF +1.90%, CADCHF +1.23%), while CHF crosses occupied most of the bottom ranks. The 2-week context reinforced the same directional bias for several of these pairs.
Analysis: USD strength aligned with a firmer DXY (+1.12%) and rising US yields as markets priced a more hawkish Fed path. CHF weakness was more pronounced and consistent with the broader risk-on tone visible in equities (especially Japan and Europe) and the sharp drop in gold. NZD and JPY held up reasonably well (second and third in the ranking), while AUD lagged. The net result was a clean long-USD / short-CHF bias that produced the week’s best and worst FX outcomes.
Global Indices
Japan led the equity complex (+4.85%), while Europe (+4.35%) and Nasdaq (+3.26%) also posted solid gains. The S&P 500 finished the week higher (+2.26%). Growth and regional recovery themes were visible in the relative performance bars, with Japan and Europe leading while Gold and Oil lagged.
Analysis: The leadership from Japan and Europe versus gold underperformance pointed to a risk-on rotation and relief from prior growth/tech concerns. This occurred alongside the gold decline and mixed oil, consistent with markets pricing improved liquidity or regional catalysts rather than pure defensive demand. Emerging Markets and Finance sectors also finished near the middle of the relative ranking.
Oil, Gold & Yields
| Instrument | Open | High | Low | Close | Return % |
|---|---|---|---|---|---|
| Oil | 89.47 | 90.41 | 83.01 | 87.76 | –1.91% |
| Gold | 4070.66 | 4148.58 | 3852.45 | 3879.92 | –4.69% |
| 10Yr Yield | 4.86% | 5.17% | 4.83% | 5.15% | +6.0% |
Crude oil (WTI) was modestly lower. Gold posted a larger decline. The US 10-year yield rose sharply on the week, closing at 5.15% (up roughly 29 basis points from the prior Friday close).
Analysis: The combination of weaker gold and firmer yields aligned with a risk-on tone in parts of the FX complex (USD strength) and equities. The rise in the 10-year yield from the mid-4.8% area into the 5.15% close raised the opportunity cost of holding non-yielding assets and was a primary driver of gold’s weekly drop to fresh 2026 lows. Oil’s milder decline kept the commodity-currency picture mixed.
Broader Market Interpretation
Taken together, the week’s price action reflected a market that had begun to reprice the path of US monetary policy more hawkishly, even as equity markets staged a broad rebound that looks more like a retracement rather than a reversal at this juncture. Stronger US data and hawkish Federal Reserve commentary pushed Treasury yields higher (10-year closing at 5.15%) and lifted the dollar, raising the opportunity cost of non-yielding assets and pressuring gold to fresh 2026 lows near $3,850–$3,880. At the same time, global equity indices—led by Japan (+4.85%) and Europe (+4.35%)—advanced, suggesting that investors were cautiously rotating back into risk assets once the immediate rate-shock had been absorbed, rather than pricing a sustained growth scare.
The divergence between a stronger dollar, sharply weaker gold, modest oil softness, and solid equity gains pointed to a rate-driven adjustment rather than a uniform flight to safety. CHF, which had been a relative beneficiary in prior risk-off periods, finished as the weakest major, while USD led the ranking and NZD and JPY held up better than the commodity-linked AUD. USDCHF’s outperformance (+2.24%) and CHFJPY’s underperformance (–1.46%) captured the shift: higher US yields and a firmer DXY favored the dollar, while the franc lost its safe-haven bid amid the equity recovery.
For FX markets, this environment rewarded currencies tied to the US rate outlook and penalized those most sensitive to real-yield pressure or prior safe-haven positioning. Gold’s multi-month decline from the late-January high near $5,590 remained the clearest expression of the opportunity-cost trade, with investors continuing to emphasize rising real yields, the Fed’s shift from easing to tightening, and speculative de-grossing as the dominant drivers. The week’s data therefore showed a market still digesting a higher-for-longer rate path, but one in which equity risk appetite had stabilized enough to produce broad gains outside of precious metals.
FX Performance Composite
This chart provides the visual summary of relative FX strength, S&P 500 pivot/Fibonacci levels, and the relative performance of Oil, Gold, DXY, and major global indices/sectors.
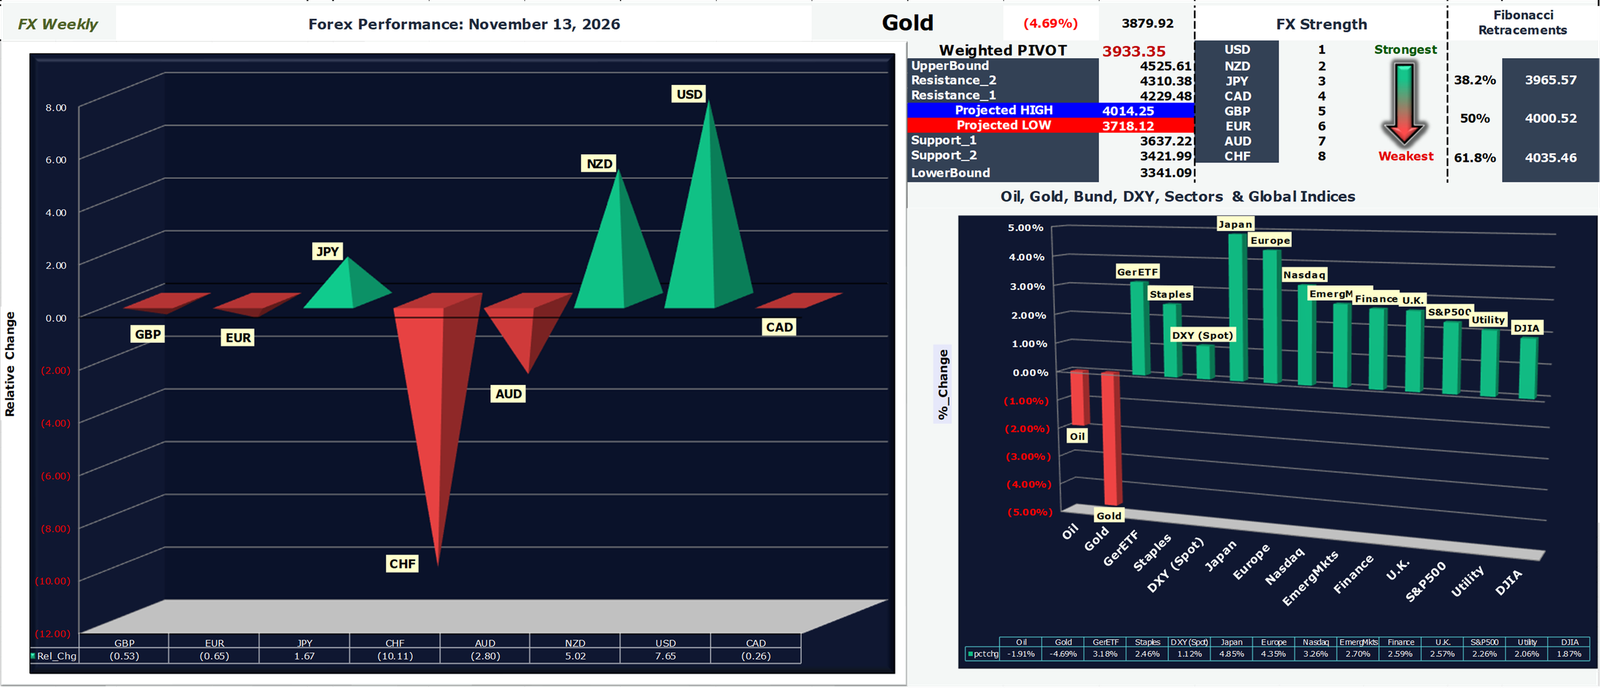
Chart of Interest: Gold
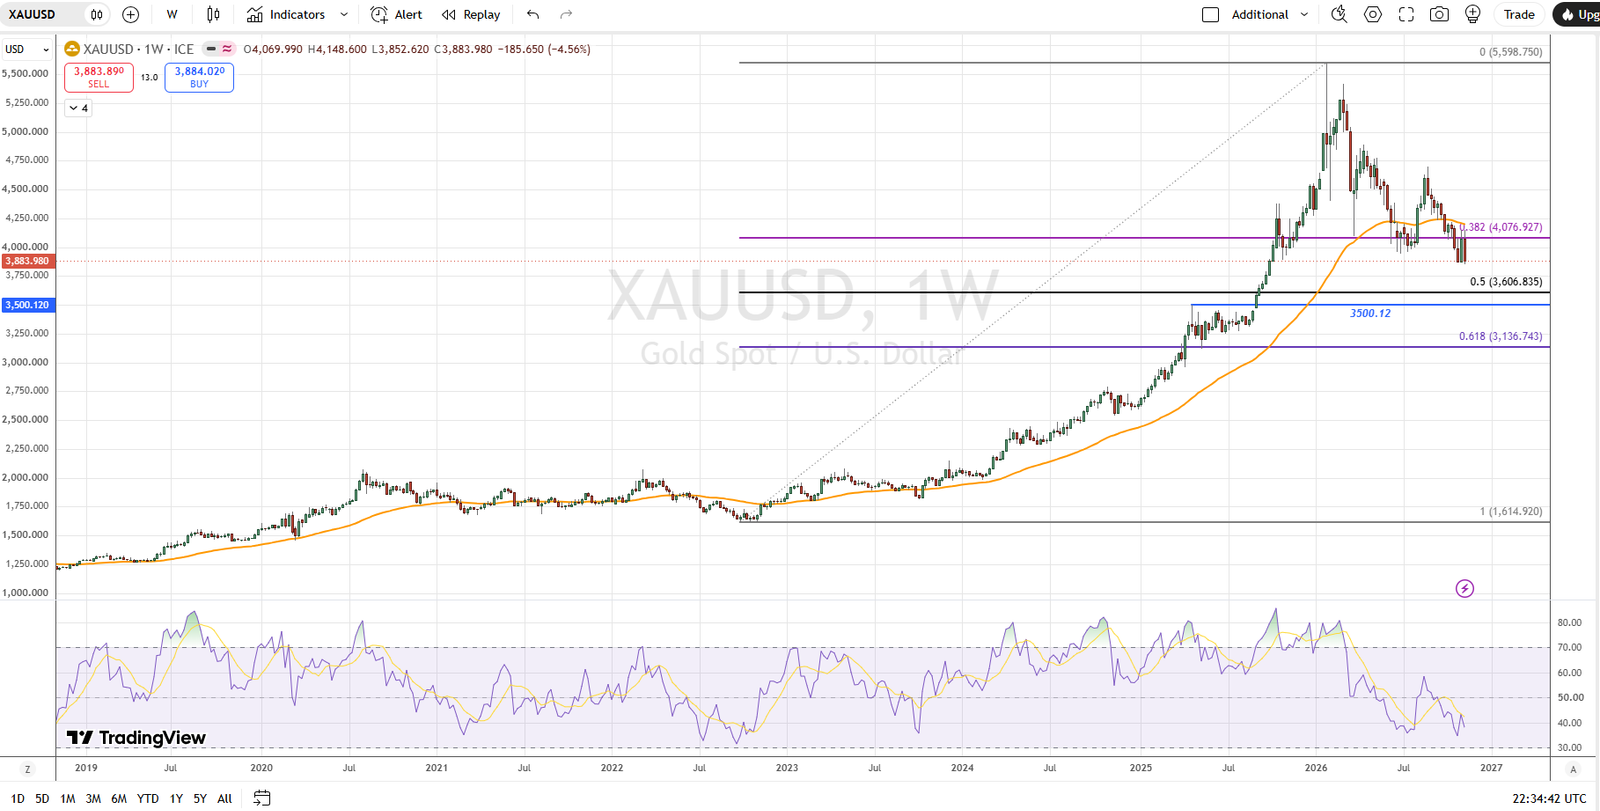
Chart notes:
Gold’s absolute high of the year was approximately $5,586–$5,595 (intraday) on 28–29 January 2026. By the week ending 13 November 2026, the metal had closed near $3,880–$3,884 (weekly open ~4,070, high ~4,149, low ~3,853, close ~3,880; –4.6% on the week). The multi-month drawdown of roughly 30% from the January peak has been driven by a clear shift in the macro rate environment rather than a collapse in underlying physical or central-bank demand.
- Rising real yields and opportunity cost: The rise in US Treasury yields—particularly real yields—are the primary driver. Higher yields raise the opportunity cost of holding a non-yielding asset. The 10-year yield moved from the mid-4% area earlier in the year toward 5%+ levels in October–November, with front-end yields rising even more sharply on hawkish Fed repricing. This week’s close at 5.15% extended that pressure.
- Hawkish Fed pivot and policy path reversal: After ending 2025 in an easing posture, the Fed raised rates in September 2026 (first hike since mid 2023) and markets have progressively priced additional tightening. Sticky inflation data, hawkish commentary from officials (including Waller and others), and FedWatch probabilities shifting toward further hikes have reinforced the view that rates will stay higher for longer. This is the inverse of the aggressive easing expectations that helped fuel the late-2025/early-2026 rally.
- Stronger US dollar: A firmer DXY, a compounding factor alongside yields, has made gold more expensive for non-USD buyers and added to the headwinds.
- Speculative de-grossing and positioning: After a parabolic advance into the January high, crowded long positions (visible in CFTC data) were unwound. Margin dynamics, volatility spikes, and some forced liquidation amid equity volatility amplified the initial decline. ETF flows have been mixed (some residual buying, but net demand has moderated relative to 2025), while futures traders reduced net longs.
- Geopolitics secondary to rates: Despite ongoing conflicts, the rate/yield story has dominated. Higher oil prices in certain periods raised inflation concerns, which fed back into hawkish Fed pricing and further pressured gold—the opposite of a pure safe-haven bid.
Pivot Points, Range Projections, Support & Resistance & Fibonacci Levels
Range (HIGH/LOW) predictions for the next trading period. The weighted pivot point serves as the midpoint of market sentiment. If the market in the subsequent period trades above the pivot point, it exhibits bullish sentiment, whereas trading below it indicates a bearish bias. Fibonacci retracements identify potential support, resistance, and reversal levels derived from mathematical ratios in the Fibonacci sequence.