
What Is the JPM Collar?
The “JPM collar” refers to a large, structured options position—widely associated with JPMorgan’s hedging program—that is implemented on the S&P 500. While the exact composition can vary slightly over time, the structure typically resembles:
-
-
- Long put (downside protection)
- Short call (upside cap)
- Short put (to help finance the structure)
-
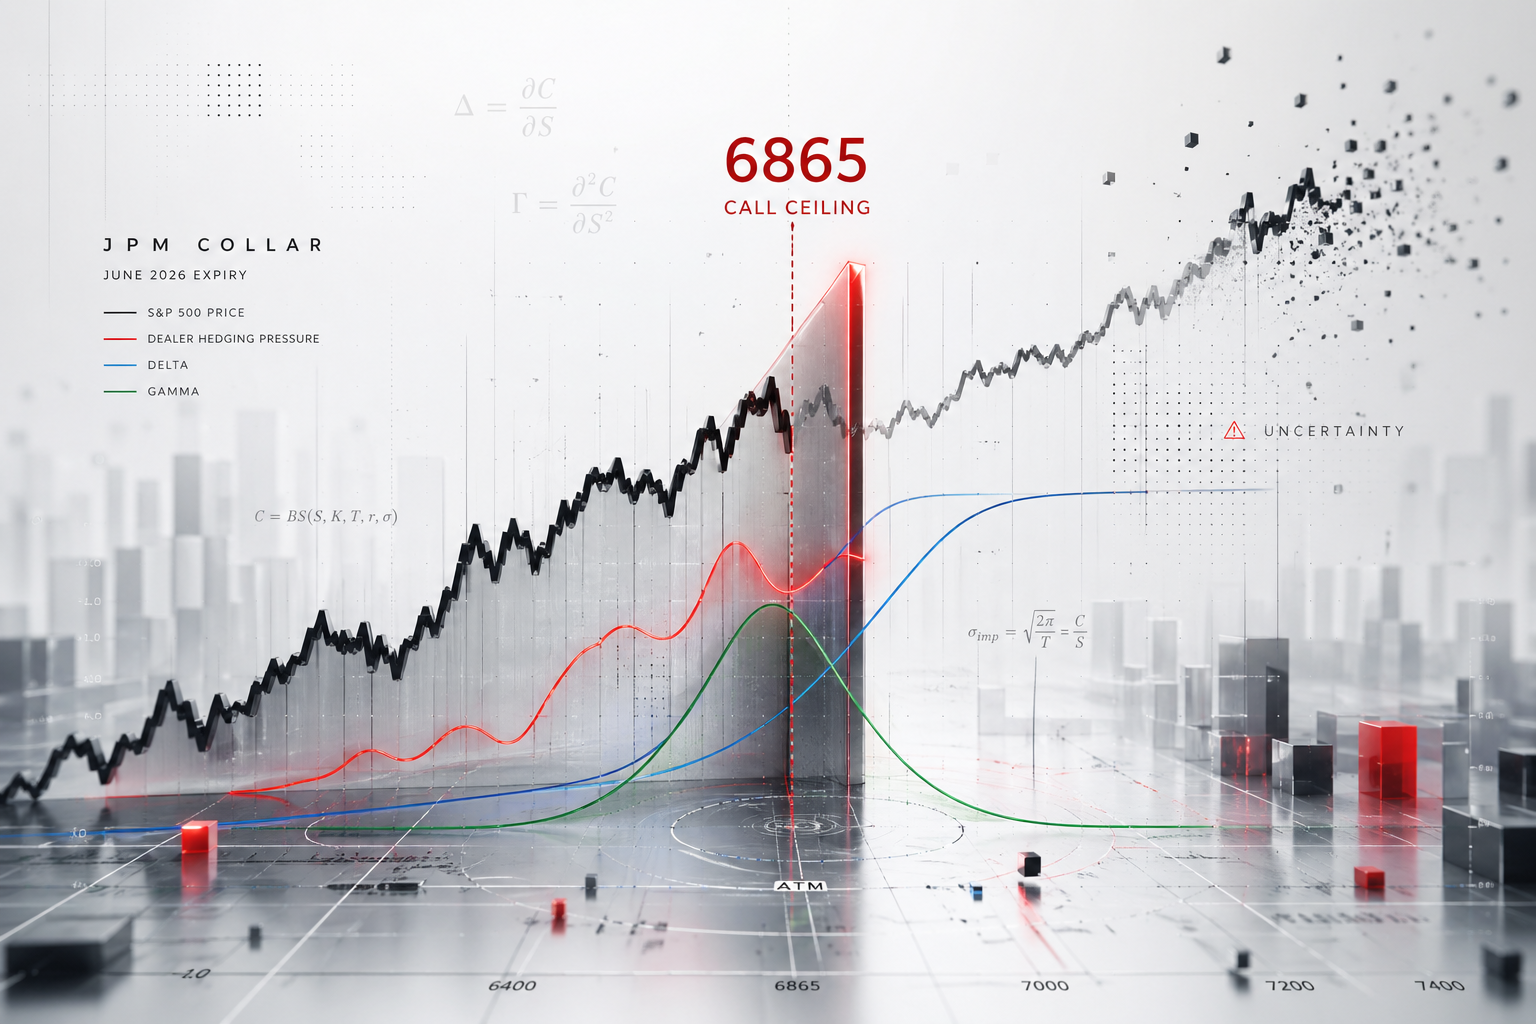
The key feature is the short call strike, often referred to as the “ceiling”. This is the level where upside in the S&P 500 is effectively capped for the holder of the structure.
For June 2026, assume the widely referenced call ceiling is ~6865. This level becomes important not because of the trade itself—but because of how dealers hedge the exposure created by it.
Size Matters: Contracts and Notional Exposure
One of the reasons the JPM collar attracts so much attention is its sheer scale.
While exact figures vary slightly by quarter, the structure is commonly estimated to involve:
-
-
- ~40,000 – 50,000 S&P 500 option contracts per leg
-
To translate that into something more tangible:
Contract Multiplier
-
-
- Each S&P 500 (SPX) option contract controls:
-
- $100 × index level
-
- Each S&P 500 (SPX) option contract controls:
-
At a 6865 index level:
-
-
- Notional per contract ≈ $686,500
-
Total Notional Exposure
Using a midpoint estimate:
-
-
- 45,000 contracts × $686,500 ≈ $30.9 billion
-
So each leg of the structure is on the order of:
~$25B – $35B in notional exposure
This is what makes the collar relevant:
-
-
- Not because it exists
- But because it is large enough to influence dealer hedging flows at the index level
-
Why This Size Impacts the Market
Dealers hedging tens of billions in notional exposure cannot do so passively.
Instead, they must:
This creates:
Systematic, mechanical flow tied directly to price movement
At scale, that flow can:
-
-
- Absorb volatility (near the strike)
- Reinforce trends (away from the strike)
-
The Mechanism: From Options to Market Flow
To understand the impact, you need to focus on two variables:
-
-
-
- DeltaA measure of the change in an option's price for every $1 change in the underlying instrument. It also serves as a rough proxy for the probability that the option will expire in the money. More (Δ)
-
- Measures how much the option behaves like the underlying
- Ranges from 0 → 1 for a call
-
- GammaMeasures the rate of change in Delta. It shows how much the Delta will shift as the price of the underlying instrument moves, reflecting the stability of an option's price sensitivity. More (Γ)
- DeltaA measure of the change in an option's price for every $1 change in the underlying instrument. It also serves as a rough proxy for the probability that the option will expire in the money. More (Δ)
-
-
The Core Dynamic
Because dealers are long the call, they must hedge their exposure by trading S&P futures (or equivalent).
This creates a feedback loop:
-
-
-
- As the market rises → deltaA measure of the change in an option's price for every $1 change in the underlying instrument. It also serves as a rough proxy for the probability that the option will expire in the money. More increases → dealers sell futures
- As the market falls → deltaA measure of the change in an option's price for every $1 change in the underlying instrument. It also serves as a rough proxy for the probability that the option will expire in the money. More decreases → dealers buy futures
-
-
This behavior is what drives pinning, stabilization, or acceleration depending on where the market is relative to the strike.
A Walk Through the June 2026 Collar (6865)
Let’s map out how this evolves across price levels.
1. Well Below 6865 (e.g., 6600)
Option state:
-
-
-
-
-
-
- Call is out-of-the-money
- DeltaA measure of the change in an option's price for every $1 change in the underlying instrument. It also serves as a rough proxy for the probability that the option will expire in the money. More ≈ 0.20–0.30
- GammaMeasures the rate of change in Delta. It shows how much the Delta will shift as the price of the underlying instrument moves, reflecting the stability of an option's price sensitivity. More rising, but not yet extreme
-
-
-
-
-
Dealer position:
Hedge:
-
-
-
-
-
-
- Dealers hold a small short futures position
-
-
-
-
-
Flow behavior:
-
-
-
-
-
-
- Market rises → dealers sell more
- Market falls → dealers buy back
-
-
-
-
-
Impact:
Mild stabilization, but not dominant
2. Approaching 6865 (e.g., 6800–6865)
Option state:
-
-
-
-
-
-
- Near at-the-money
- DeltaA measure of the change in an option's price for every $1 change in the underlying instrument. It also serves as a rough proxy for the probability that the option will expire in the money. More ≈ 0.45–0.55
- GammaMeasures the rate of change in Delta. It shows how much the Delta will shift as the price of the underlying instrument moves, reflecting the stability of an option's price sensitivity. More = MAX
-
-
-
-
-
Dealer position:
Hedge:
-
-
-
-
-
-
- Dealers actively sell futures into strength
- Dealers actively buy futures into weakness
-
-
-
-
-
Flow behavior:
| Market Move | Dealer Action |
|---|---|
| Up | Sell futures |
| Down | Buy futures |
This is where:
-
-
-
-
-
-
- Volatility compresses
- Intraday reversals increase
- Breakouts struggle to hold
-
-
-
-
-
Impact:
Strong pinning effect
The market behaves like it is “magnetized” to 6865
3. Just Above 6865 (e.g., 6900–7000)
Option state:
-
-
-
-
-
-
- In-the-money
- DeltaA measure of the change in an option's price for every $1 change in the underlying instrument. It also serves as a rough proxy for the probability that the option will expire in the money. More ≈ 0.60–0.80
- GammaMeasures the rate of change in Delta. It shows how much the Delta will shift as the price of the underlying instrument moves, reflecting the stability of an option's price sensitivity. More declining
-
-
-
-
-
Dealer position:
Hedge:
-
-
-
-
-
-
- Dealers continue to sell futures, but at a slower rate
-
-
-
-
-
Flow behavior:
-
-
-
-
-
-
- Still somewhat stabilizing, but weakening
-
-
-
-
-
Impact:
The “pin” starts to loosen
Market can begin to trend, but with friction
4. Well Above 6865 (e.g., 7126)
Option state:
-
-
-
-
-
-
- Deep in-the-money
- DeltaA measure of the change in an option's price for every $1 change in the underlying instrument. It also serves as a rough proxy for the probability that the option will expire in the money. More ≈ 0.90–1.00
- GammaMeasures the rate of change in Delta. It shows how much the Delta will shift as the price of the underlying instrument moves, reflecting the stability of an option's price sensitivity. More ≈ 0
-
-
-
-
-
Dealer position:
-
-
-
-
-
-
- Call behaves almost like long stock
-
-
-
-
-
Hedge:
-
-
-
-
-
-
- Dealers hold a near-static short futures position
-
-
-
-
-
Flow behavior:
-
-
-
-
-
-
- Minimal rebalancing
- Hedging becomes insensitive to price changes
-
-
-
-
-
Impact:
Pinning disappears
The market is now free to trend
Deep in-the-money, the dealer’s long call behaves like long stock: deltaA measure of the change in an option's price for every $1 change in the underlying instrument. It also serves as a rough proxy for the probability that the option will expire in the money. More approaches 1 and gammaMeasures the rate of change in Delta. It shows how much the Delta will shift as the price of the underlying instrument moves, reflecting the stability of an option's price sensitivity. More collapses. Hedging becomes largely static, but not inert—adjustments are minimal on continued upside and accelerate again if the market reverses.
5. On the Way Back Down
Assume the market falls from 7126 back toward 6865.
What changes?
-
-
-
-
-
-
- DeltaA measure of the change in an option's price for every $1 change in the underlying instrument. It also serves as a rough proxy for the probability that the option will expire in the money. More drops (1 → 0.7 → 0.5)
- GammaMeasures the rate of change in Delta. It shows how much the Delta will shift as the price of the underlying instrument moves, reflecting the stability of an option's price sensitivity. More increases again
-
-
-
-
-
Dealer response:
Impact:
Dealers now support the market on the way down
As price approaches 6865 again:
The Big Picture: Regimes, Not Levels
The most important takeaway is this:
The JPM collar doesn’t “control” the market at a fixed level—it defines a regime of behavior.
Two Distinct Regimes
1. Near the Strike (High Gamma)
-
-
-
-
-
- Dealers buy dips / sell rips
- Volatility compresses
- Price gravitates toward the strike
-
-
-
-
👉 Mean-reverting environment
2. Far From the Strike (Low Gamma)
-
-
-
-
-
- Hedging slows dramatically
- Dealer influence fades
- External flows dominate
-
-
-
-
👉 Trend environment
A Practical Interpretation
When analyzing the S&P 500 around a known collar level like 6865:
-
-
-
-
- Near the level: expect chop, reversals, failed breakouts
- Breaking away: expect expanding volatility
- Far above/below: expect trend persistence
-
-
-
Final Thought
The JPM collar is often described as a “ceiling,” but that framing is incomplete.
A more accurate interpretation is:
It is a source of mechanical hedging flow that can either stabilize or release the market depending on where price sits relative to it.
Understanding that distinction—between level and regime—is what turns this from an interesting concept into a practical framework. If you build your lens around gammaMeasures the rate of change in Delta. It shows how much the Delta will shift as the price of the underlying instrument moves, reflecting the stability of an option's price sensitivity. More concentration and dealer hedging behavior, the collar stops being a mystery and starts becoming a map.
