
What Is Backwardation?
Backwardation is a market condition where futures prices trade below the current spot price of an asset. That may seem counterintuitive—most of us expect prices to rise over time—but in certain environments, the immediate value of an asset outweighs its future value. Simply put, the market is pricing today higher than tomorrow.
Why does it happen?
Backwardation typically emerges when near-term demand or scarcity dominates the pricing structure. The most common drivers are:
-
-
- Tight physical supply (low inventories, production constraints)
- Demand concentrated in the present
- Disruptions (logistics, geopolitics, weather)
- High “convenience yield” — the benefit of owning the asset now rather than later
-
At a high level, backwardation reflects a simple imbalance: The market places a premium on immediate access.
The Mechanics — How the Curve Gets There
To understand backwardation, it helps to contrast it with its opposite: contango.
-
-
- In contango, futures are priced above spot → no urgency, carrying costs dominate. This is a normal market.
- In backwardation, futures are priced below spot → immediacy dominates
-
Backwardation vs. Contango
| Structure | Curve Shape | What it Signals |
|---|---|---|
| Backwardation | Downward sloping | Near-term tightness |
| Contango | Upward sloping | Ample supply / storage-driven pricing |
The Pricing Framework
Futures pricing is generally described as:
Futures = Spot + Carry Costs − Convenience Yield
Where:
-
-
- Carry costs include storage, insurance, and financing
- Convenience yield reflects the non-monetary benefit of holding the physical asset
-
What flips the curve?
Backwardation occurs when:
Convenience yield exceeds carry costs
This typically happens when:
-
-
- Inventories are low
- Supply chains are strained
- The asset is critical to ongoing activity (energy, industrial inputs, etc.)
-
In these conditions, owning the asset today provides flexibility and certainty that futures contracts cannot.
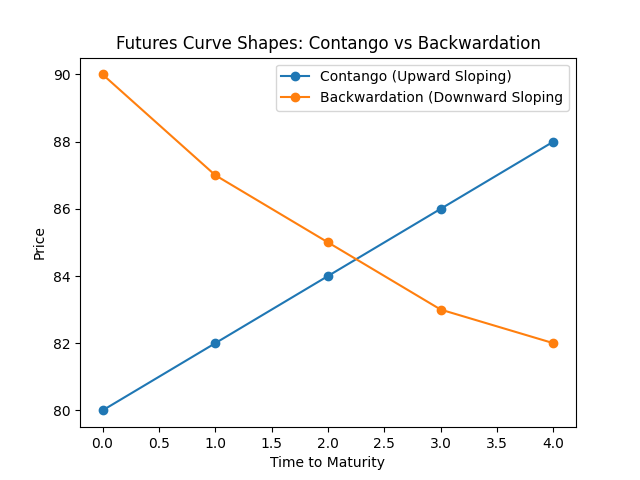
The Shape of the Curve
A ‘backwardated’ curve slopes downward whereas contango slopes upward.
-
-
- Front-month contracts trade at a premium
- Longer-dated contracts trade at progressively lower prices
-
The curve embeds an expectation:
Current tightness is unlikely to persist indefinitely.
Backwardation & Inflation Expectations
Backwardation has a subtle but important relationship with inflation—specifically how inflation is distributed across time.
Near-Term vs. Forward Inflation
When a market is in backwardation:
-
-
- Spot prices are elevated → reflects current price pressure
- Futures prices are lower → implies expected easing
-
That creates a split dynamic:
| Time Horizon | Signal |
|---|---|
| Short-term | Inflationary pressure is elevated |
| Long-term | Inflation is expected to moderate |
What the Market Is Really Saying
Backwardation often aligns with:
“Inflation now, normalization later.”
This shows up clearly in commodities like energy:
-
-
- A supply shock (e.g., disruption in oil supply) pushes spot prices higher
- Futures curves discount the assumption that:
-
-
- Supply will adjust
- Demand will cool
- Prices will stabilize
-
-
-
Why This Matters
This distinction is critical because it helps explain situations where:
-
-
- Headline inflation prints hot, but
- Long-term inflation expectations remain anchored
-
In other words, backwardation can coexist with a credible disinflation narrative—the market sees the pressure, but doesn’t believe it’s permanent.
Case Study — A Practical Example
The Setup
Consider crude oil:
-
-
- Spot price: $90/barrel
- 3-month futures: $85
- 6-month futures: $82
-
What the market is saying
-
-
- Immediate supply is tight
- Buyers are willing to pay up for prompt delivery
- Over time, the market expects supply/demand to rebalance
-
Interpretation
This is a textbook backwardation structure:
-
-
- The front end is elevated due to near-term pressure
- The back end is discounted, reflecting normalization expectations
-
Why this matters for investors
Backwardation creates something called positive roll yield.
If an investor holds futures exposure:
-
-
- They sell a higher-priced near contract
- They buy a lower-priced longer-dated contract
-
That “roll” generates a structural tailwind, independent of spot price movement.
Real-World Context — Where You See It
Backwardation tends to show up when real-world frictions impact supply.
Common catalysts
-
-
- Geopolitical tension affecting production or exports
- Weather events disrupting output (e.g., energy, agriculture)
- Transportation bottlenecks
- Sudden demand spikes
-
These forces create localized or short-term shortages, even if long-term supply remains adequate.
Market Implications
-
-
- Inventory Behavior
- Firms are less incentivized to store commodities
- Holding inventory becomes costly relative to selling now
- Producer Behavior
- Producers may accelerate sales to capture elevated spot prices
- Pricing Signal
- Indicates tight physical markets
- Often associated with near-term inflation pressure
- Inventory Behavior
-
Important nuance
Backwardation is often interpreted as bullish—but that’s incomplete. It actually reflects:
-
-
- Strength in the present
- Expectations of moderation over time
-
In other words:
It is a short-term signal, not necessarily a long-term trend.
Bottom Line
Backwardation is a pricing structure where:
-
-
- Spot prices exceed futures prices
- The curve slopes downward
- The market prioritizes immediacy over time
-
It typically arises when:
-
-
- Supply is constrained
- Demand is front-loaded
- Holding the asset today has meaningful value
-
For investors and observers, it offers a clear takeaway:
Backwardation signals tight conditions now—and an expectation that those conditions will ease.
