
| Yield Curve (Current) | ||||||||
|---|---|---|---|---|---|---|---|---|
| 3-mo | 6-mo | 1-yr | 2-yr | 5-yr | 10-yr | 30-yr | AaaAaa represents the highest rung of investment-grade corporate debt, indicating top-level creditworthiness and the lowest default risk. More | BaaBaa represent the lowest rung of investment-grade corporate debt with moderate credit risk, making them susceptible to higher default risk than Aaa bonds. More |
| 3.83 | 3.92 | 4 | 4.19 | 4.23 | 4.46 | 4.9 | 5.5 | 5.97 |
| Date | 3-mth | 6-mth | 1-yr | 2-yr | 5-yr | 10-yr | 30-yr | AaaAaa represents the highest rung of investment-grade corporate debt, indicating top-level creditworthiness and the lowest default risk. More | BaaBaa represent the lowest rung of investment-grade corporate debt with moderate credit risk, making them susceptible to higher default risk than Aaa bonds. More | HY-OAS | 5Y5Y5Y5Y forward rate provides a market-implied view of where policy ultimately settles once cyclical forces dissipate. Importantly, it captures the destination of policy rather than its near-term trajectory, and should be interpreted as a structural anchor rather than a tactical signal. More Forward | 5Y Breakeven Inflation |
|---|---|---|---|---|---|---|---|---|---|---|---|---|
| 6/19/2026 | 3.83 | 3.92 | 4.00 | 4.19 | 4.23 | 4.46 | 4.90 | 5.5 | 5.97 | 2.66 | 2.23 | 2.27 |
| 6/12/2026 | 3.78 | 3.82 | 3.86 | 4.09 | 4.21 | 4.48 | 4.97 | 5.52 | 6.01 | 2.71 | 2.23 | 2.39 |
| 6/5/2026 | 3.78 | 3.81 | 3.88 | 4.17 | 4.29 | 4.55 | 5.01 | 5.53 | 6.06 | 2.76 | 2.24 | 2.48 |
| 5/29/2026 | 3.69 | 3.78 | 3.79 | 3.98 | 4.13 | 4.45 | 4.99 | 5.5 | 6.02 | 2.72 | 2.24 | 2.52 |
| 5/22/2026 | 3.68 | 3.79 | 3.86 | 4.13 | 4.27 | 4.56 | 5.07 | 5.61 | 6.13 | 2.74 | 2.26 | 2.54 |
| 5/15/2026 | 3.69 | 3.77 | 3.82 | 4.09 | 4.26 | 4.59 | 5.12 | 5.65 | 6.21 | 2.80 | 2.28 | 2.7 |
| 5/8/2026 | 3.69 | 3.74 | 3.75 | 3.90 | 4.02 | 4.38 | 4.95 | 5.47 | 6.03 | 2.81 | 2.28 | 2.62 |
| 5/1/2026 | 3.68 | 3.71 | 3.73 | 3.88 | 4.02 | 4.39 | 4.97 | 5.49 | 6.08 | 2.77 | 2.27 | 2.69 |
| 4/24/2026 | 3.69 | 3.71 | 3.67 | 3.78 | 3.92 | 4.31 | 4.91 | 5.41 | 6.01 | 2.86 | 2.23 | 2.61 |
| 4/17/2026 | 3.70 | 3.69 | 3.64 | 3.71 | 3.84 | 4.26 | 4.88 | 5.36 | 5.98 | 2.83 | 2.16 | 2.56 |
| 4/10/2026 | 3.69 | 3.72 | 3.70 | 3.81 | 3.94 | 4.31 | 4.91 | 5.42 | 6.03 | 2.94 | 2.14 | 2.58 |
| 4/3/2026 | 3.71 | 3.73 | 3.72 | 3.84 | 3.99 | 4.35 | 4.91 | 5.44 | 6.05 | 3.13 | 2.11 | 2.61 |
| 3/27/2026 | 3.73 | 3.75 | 3.77 | 3.88 | 4.06 | 4.44 | 4.98 | 5.66 | 6.22 | 3.42 | 2.06 | 2.56 |
| 3/20/2026 | 3.74 | 3.79 | 3.80 | 3.88 | 4.01 | 4.39 | 4.96 | 5.61 | 6.18 | 3.24 | 2.13 | 2.63 |
| 3/13/2026 | 3.72 | 3.70 | 3.66 | 3.73 | 3.87 | 4.28 | 4.90 | 5.60 | 6.11 | 3.28 | 2.11 | 2.61 |
| 3/6/2026 | 3.71 | 3.68 | 3.56 | 3.53 | 3.67 | 4.10 | 4.73 | 5.32 | 5.86 | 3.13 | 2.14 | 2.56 |
| 2/27/2026 | 3.68 | 3.61 | 3.48 | 3.42 | 3.58 | 4.02 | 4.64 | 5.25 | 5.77 | 3.10 | 2.1 | 2.40 |
| 2/20/2026 | 3.69 | 3.60 | 3.51 | 3.46 | 3.65 | 4.08 | 4.72 | 5.25 | 5.76 | 2.86 | 2.13 | 2.43 |
| 2/13/2026 | 3.68 | 3.59 | 3.42 | 3.40 | 3.61 | 4.04 | 4.69 | 5.31 | 5.81 | 2.95 | 2.12 | 2.42 |
| 2/6/2026 | 3.68 | 3.59 | 3.45 | 3.54 | 3.80 | 4.26 | 4.85 | 5.40 | 5.90 | 2.87 | 2.18 | 2.50 |
| 1/30/2026 | 3.67 | 3.61 | 3.48 | 3.54 | 3.81 | 4.24 | 4.87 | 5.35 | 5.86 | 2.80 | 2.19 | 2.53 |
Source: Federal Reserve Economic Data (FRED) is an online database created and maintained by the Research Department at the Federal Reserve Bank of St. Louis
This week’s Treasury market exhibited a highly non-parallel repricing, with front-end yields moving higher while longer-duration yields declined. The divergence suggests markets are reassessing the path of monetary policy while simultaneously becoming more comfortable with the longer-term inflation outlook. Financial conditions produced a mixed signal: policy-sensitive rates tightened modestly, while lower long-end yields, tighter credit spreadsIn the bond market, it is the difference in yield between a corporate bond and a "risk-free" government bond of the same maturity. It represents the extra interest investors demand to compensate for the risk that a company might default. More, and declining volatility provided support for risk assets.
Macro Structure: Front-End-Led Bear Flattening
-
-
-
- Front end:
- 3M → 3.83% (↑ +5bp)
- 1Y → 4.00% (↑ +14bp)
- 2Y → 4.19% (↑ +10bp)
- 5Y → 4.23% (↑ +2bp)
- Front end:
-
-
→ The rise in short-term yields suggests markets are pushing back against near-term easing expectations and repricing toward a more restrictive policy path. The move is consistent with a more hawkish interpretation of recent Fed communication and a higher-for-longer rate environment.
-
-
-
- Long end:
- 10Y → 4.46% (↓ -2bp)
- 30Y → 4.90% (↓ -7bp)
- Long end:
-
-
→ Long-duration yields moved lower despite rising front-end rates, indicating that investors remain relatively confident that inflation will continue moderating over time.
→ The decline in the 30-year Treasury yield suggests reduced pressure from term-premium expansion and a renewed bid for durationBond Duration: Estimates the percentage change in a bond’s price for every 1% shift in interest rates. For example, a bond with a 3-year duration will gain or lose roughly ±3% of its value if rates fall or rise by 1%. More, even as policy-sensitive maturities adjusted higher.
Curve & Inflation Signals
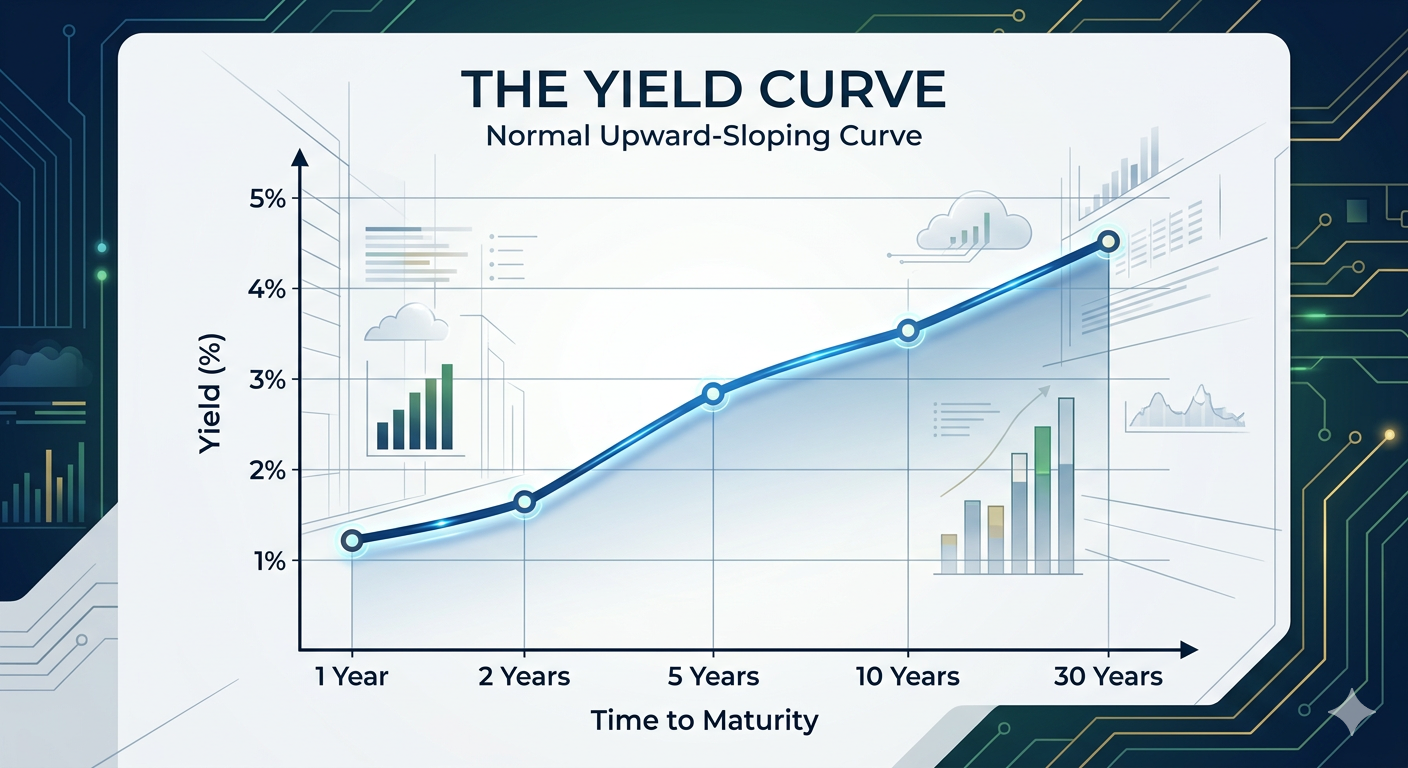
The curve remains positively sloped, but this week’s move clearly reflected bear-flatteningA bear flattener is a yield curve shift where short-term interest rates rise faster than long-term rates and often signals potential economic contraction or slower growth ahead. More characteristics as front-end yields rose while the long end moved lower.
-
-
-
- 10Y–3M spread: +63bp (↓ -7bp)
- 30Y–2Y spread: +71bp (↓ -17bp)
-
-
→ The sharp compression in longer-dated spreads reflects a market repricing toward tighter near-term policy conditions without a corresponding increase in long-run inflation concerns.
-
-
-
- 5Y5Y5Y5Y forward rate provides a market-implied view of where policy ultimately settles once cyclical forces dissipate. Importantly, it captures the destination of policy rather than its near-term trajectory, and should be interpreted as a structural anchor rather than a tactical signal. More Forward: 2.23% (unchanged)
- 5Y Breakeven Inflation: 2.27% (↓ -12bp)
-
-
→ Inflation expectations continued to moderate, with breakevens falling meaningfully during the week. The combination of stable forward inflation expectations and declining breakevens suggests markets are becoming increasingly comfortable with the broader disinflation trend.
Credit Markets
Credit conditions improved despite the rise in front-end Treasury yields.
-
-
-
- AaaAaa represents the highest rung of investment-grade corporate debt, indicating top-level creditworthiness and the lowest default risk. More: 5.50% (↓ -2bp)
- BaaBaa represent the lowest rung of investment-grade corporate debt with moderate credit risk, making them susceptible to higher default risk than Aaa bonds. More: 5.97% (↓ -4bp)
- Baa–AaaAaa represents the highest rung of investment-grade corporate debt, indicating top-level creditworthiness and the lowest default risk. More spread: +47bp (↓ -2bp)
- HY OAS: 2.66% (↓ -5bp)
-
-
→ High-yield spreads narrowed further, indicating that investors continue to view corporate credit risk as manageable. Credit markets remain broadly supportive of the soft-landing narrative and are not signaling meaningful economic stress.
MOVE Index
The ICE Bank of America U.S. Bond Market Option Volatility Estimate (MOVE) Index measures implied volatility of U.S. Treasury yields, derived from options on Treasuries (primarily 2Y–30Y maturities). It’s commonly called the “VIX for bonds”, but more precisely, it reflects the market’s expectation of how much Treasury yields will move, not bond prices. It is a critical cross-asset signal.
| Bond VIX | ||||||||||||||||||||||||||||||||||||||||||||||||||||||||||||||||||||||||||||||||||||||||||||||||||||||||||||||||||||||||||||||||||||||||||||||||||||||||||||||||||||||||||||||||||||||||||||||||||||||||||||||||||||||||||||||||||||||||||||||||||||||||||||||||||||||||||||||||||||||||||||||||||||||||||||||||||||||||||||||||||||||||||||||||||
|---|---|---|---|---|---|---|---|---|---|---|---|---|---|---|---|---|---|---|---|---|---|---|---|---|---|---|---|---|---|---|---|---|---|---|---|---|---|---|---|---|---|---|---|---|---|---|---|---|---|---|---|---|---|---|---|---|---|---|---|---|---|---|---|---|---|---|---|---|---|---|---|---|---|---|---|---|---|---|---|---|---|---|---|---|---|---|---|---|---|---|---|---|---|---|---|---|---|---|---|---|---|---|---|---|---|---|---|---|---|---|---|---|---|---|---|---|---|---|---|---|---|---|---|---|---|---|---|---|---|---|---|---|---|---|---|---|---|---|---|---|---|---|---|---|---|---|---|---|---|---|---|---|---|---|---|---|---|---|---|---|---|---|---|---|---|---|---|---|---|---|---|---|---|---|---|---|---|---|---|---|---|---|---|---|---|---|---|---|---|---|---|---|---|---|---|---|---|---|---|---|---|---|---|---|---|---|---|---|---|---|---|---|---|---|---|---|---|---|---|---|---|---|---|---|---|---|---|---|---|---|---|---|---|---|---|---|---|---|---|---|---|---|---|---|---|---|---|---|---|---|---|---|---|---|---|---|---|---|---|---|---|---|---|---|---|---|---|---|---|---|---|---|---|---|---|---|---|---|---|---|---|---|---|---|---|---|---|---|---|---|---|---|---|---|---|---|---|---|---|---|---|---|---|---|---|---|---|---|---|---|---|---|---|---|---|---|---|---|---|---|---|---|---|---|---|---|---|---|---|---|---|---|---|---|---|---|---|---|
| Date | 1/3/2020 | 1/10/2020 | 1/17/2020 | 1/24/2020 | 1/31/2020 | 2/7/2020 | 2/14/2020 | 2/21/2020 | 2/28/2020 | 3/6/2020 | 3/13/2020 | 3/20/2020 | 3/27/2020 | 4/3/2020 | 4/10/2020 | 4/17/2020 | 4/24/2020 | 5/1/2020 | 5/8/2020 | 5/15/2020 | 5/22/2020 | 5/29/2020 | 6/5/2020 | 6/12/2020 | 6/19/2020 | 6/26/2020 | 7/3/2020 | 7/10/2020 | 7/17/2020 | 7/24/2020 | 7/31/2020 | 8/7/2020 | 8/14/2020 | 8/21/2020 | 8/28/2020 | 9/4/2020 | 9/11/2020 | 9/18/2020 | 9/25/2020 | 10/2/2020 | 10/9/2020 | 10/16/2020 | 10/23/2020 | 10/30/2020 | 11/6/2020 | 11/13/2020 | 11/20/2020 | 11/27/2020 | 12/4/2020 | 12/11/2020 | 12/18/2020 | 12/25/2020 | 1/1/2021 | 1/8/2021 | 1/15/2021 | 1/22/2021 | 1/29/2021 | 2/5/2021 | 2/12/2021 | 2/19/2021 | 2/26/2021 | 3/5/2021 | 3/12/2021 | 3/19/2021 | 3/26/2021 | 4/2/2021 | 4/9/2021 | 4/16/2021 | 4/23/2021 | 4/30/2021 | 5/7/2021 | 5/14/2021 | 5/21/2021 | 5/28/2021 | 6/4/2021 | 6/11/2021 | 6/18/2021 | 6/25/2021 | 7/2/2021 | 7/9/2021 | 7/16/2021 | 7/23/2021 | 7/30/2021 | 8/6/2021 | 8/13/2021 | 8/20/2021 | 8/27/2021 | 9/3/2021 | 9/10/2021 | 9/17/2021 | 9/24/2021 | 10/1/2021 | 10/8/2021 | 10/15/2021 | 10/22/2021 | 10/29/2021 | 11/5/2021 | 11/12/2021 | 11/19/2021 | 11/26/2021 | 12/3/2021 | 12/10/2021 | 12/17/2021 | 12/24/2021 | 12/31/2021 | 1/7/2022 | 1/14/2022 | 1/21/2022 | 1/28/2022 | 2/4/2022 | 2/11/2022 | 2/18/2022 | 2/25/2022 | 3/4/2022 | 3/11/2022 | 3/18/2022 | 3/25/2022 | 4/1/2022 | 4/8/2022 | 4/15/2022 | 4/22/2022 | 4/29/2022 | 5/6/2022 | 5/13/2022 | 5/20/2022 | 5/27/2022 | 6/3/2022 | 6/10/2022 | 6/17/2022 | 6/24/2022 | 7/1/2022 | 7/8/2022 | 7/15/2022 | 7/22/2022 | 7/29/2022 | 8/5/2022 | 8/12/2022 | 8/19/2022 | 8/26/2022 | 9/2/2022 | 9/9/2022 | 9/16/2022 | 9/23/2022 | 9/30/2022 | 10/7/2022 | 10/14/2022 | 10/21/2022 | 10/28/2022 | 11/4/2022 | 11/11/2022 | 11/18/2022 | 11/25/2022 | 12/2/2022 | 12/9/2022 | 12/16/2022 | 12/23/2022 | 12/30/2022 | 1/6/2023 | 1/13/2023 | 1/20/2023 | 1/27/2023 | 2/3/2023 | 2/10/2023 | 2/17/2023 | 2/24/2023 | 3/3/2023 | 3/10/2023 | 3/17/2023 | 3/24/2023 | 3/31/2023 | 4/7/2023 | 4/14/2023 | 4/21/2023 | 4/28/2023 | 5/5/2023 | 5/12/2023 | 5/19/2023 | 5/26/2023 | 6/2/2023 | 6/9/2023 | 6/16/2023 | 6/23/2023 | 6/30/2023 | 7/7/2023 | 7/14/2023 | 7/21/2023 | 7/28/2023 | 8/4/2023 | 8/11/2023 | 8/18/2023 | 8/25/2023 | 9/1/2023 | 9/8/2023 | 9/15/2023 | 9/22/2023 | 9/29/2023 | 10/6/2023 | 10/13/2023 | 10/20/2023 | 10/27/2023 | 11/3/2023 | 11/10/2023 | 11/17/2023 | 11/24/2023 | 12/1/2023 | 12/8/2023 | 12/15/2023 | 12/22/2023 | 12/29/2023 | 1/5/2024 | 1/12/2024 | 1/19/2024 | 1/26/2024 | 2/2/2024 | 2/9/2024 | 2/16/2024 | 2/23/2024 | 3/1/2024 | 3/8/2024 | 3/15/2024 | 3/22/2024 | 3/29/2024 | 4/5/2024 | 4/12/2024 | 4/19/2024 | 4/26/2024 | 5/3/2024 | 5/10/2024 | 5/17/2024 | 5/24/2024 | 5/31/2024 | 6/7/2024 | 6/14/2024 | 6/21/2024 | 6/28/2024 | 7/5/2024 | 7/12/2024 | 7/19/2024 | 7/26/2024 | 8/2/2024 | 8/9/2024 | 8/16/2024 | 8/23/2024 | 8/30/2024 | 9/6/2024 | 9/13/2024 | 9/20/2024 | 9/27/2024 | 10/4/2024 | 10/11/2024 | 10/18/2024 | 10/25/2024 | 11/1/2024 | 11/8/2024 | 11/15/2024 | 11/22/2024 | 11/29/2024 | 12/6/2024 | 12/13/2024 | 12/20/2024 | 12/27/2024 | 1/3/2025 | 1/10/2025 | 1/17/2025 | 1/24/2025 | 1/31/2025 | 2/7/2025 | 2/14/2025 | 2/21/2025 | 2/28/2025 | 3/7/2025 | 3/14/2025 | 3/21/2025 | 3/28/2025 | 4/4/2025 | 4/11/2025 | 4/18/2025 | 4/25/2025 | 5/2/2025 | 5/9/2025 | 5/16/2025 | 5/23/2025 | 5/30/2025 | 6/6/2025 | 6/13/2025 | 6/20/2025 | 6/27/2025 | 7/4/2025 | 7/11/2025 | 7/18/2025 | 7/25/2025 | 8/1/2025 | 8/8/2025 | 8/15/2025 | 8/22/2025 | 8/29/2025 | 9/5/2025 | 9/12/2025 | 9/19/2025 | 9/26/2025 | 10/3/2025 | 10/10/2025 | 10/17/2025 | 10/24/2025 | 10/31/2025 | 11/7/2025 | 11/14/2025 | 11/21/2025 | 11/28/2025 | 12/5/2025 | 12/12/2025 | 12/19/2025 | 12/26/2025 | 1/2/2026 | 1/9/2026 | 1/16/2026 | 1/23/2026 | 1/30/2026 | 2/6/2026 | 2/13/2026 | 2/20/2026 | 2/27/2026 | 3/6/2026 | 3/13/2026 | 3/20/2026 | 3/27/2026 | 4/3/2026 | 4/10/2026 | 4/17/2026 | 4./24/2026 | 5/1/2026 | 5/8/2026 | 5/15/2026 | 5/22/2026 | 5/29/2026 | 6/5/2026 | 6/12/2026 | 6/19/2026 |
| bp | 60.12 | 53.32 | 49.67 | 59.94 | 72.98 | 65.59 | 62.38 | 74.54 | 109.67 | 125.21 | 138.4 | 133.37 | 88.33 | 65.01 | 74.39 | 69.84 | 66.09 | 48.11 | 57.4 | 56.53 | 51.67 | 51.55 | 61.97 | 55.81 | 53.45 | 51.21 | 50.96 | 49.19 | 45.68 | 42.48 | 41.98 | 41.46 | 43.09 | 45.14 | 48.19 | 47.04 | 43.12 | 37.24 | 36.97 | 39.97 | 57.52 | 57.25 | 58.46 | 61.91 | 39.88 | 42.95 | 42.31 | 39.64 | 43.89 | 47.52 | 44.64 | 42.11 | 48.98 | 44.81 | 45.14 | 43.09 | 47.41 | 47.2 | 47.01 | 60.43 | 75.66 | 69.37 | 70.83 | 68.8 | 61.49 | 63.71 | 61.21 | 62.57 | 59.98 | 58.13 | 54.13 | 54.99 | 54.59 | 52.04 | 49.78 | 50.85 | 60.45 | 55.58 | 52.41 | 59.92 | 58.24 | 65.28 | 61.19 | 62.64 | 55.45 | 59.95 | 57.98 | 53.26 | 51.73 | 56.06 | 58.46 | 57.38 | 59.65 | 62.7 | 72.04 | 75.45 | 66.9 | 78.61 | 73.39 | 89.45 | 79.14 | 74.36 | 72.46 | 77.29 | 77.1 | 74.69 | 76.59 | 81.03 | 85.29 | 87.68 | 94.03 | 94.36 | 93.34 | 131.82 | 99.03 | 91.77 | 125.27 | 108.34 | 124.86 | 119.66 | 128.12 | 128.4 | 121.42 | 114.61 | 111.1 | 98.48 | 97.73 | 114.23 | 133.75 | 127 | 144.17 | 145.25 | 129.85 | 123.7 | 116.36 | 122.58 | 106.28 | 123.81 | 122.95 | 120.72 | 121.54 | 124.95 | 137.28 | 141.89 | 148.46 | 152.89 | 156.95 | 144.6 | 128.44 | 111.69 | 129.33 | 129.6 | 118.62 | 132.79 | 113.65 | 113.17 | 121.61 | 113.87 | 113.55 | 114.76 | 100.7 | 98.99 | 109.63 | 110.11 | 122.84 | 122.52 | 140.06 | 180.11 | 173.66 | 135.93 | 139.2 | 118.84 | 120.84 | 122.46 | 130.21 | 120.52 | 127.51 | 145.37 | 120.95 | 115.77 | 104.43 | 105.74 | 110.64 | 130.41 | 112.48 | 106.66 | 109.76 | 115.91 | 112.13 | 120.51 | 110.37 | 102.92 | 104.34 | 96.61 | 101.11 | 113.55 | 126.64 | 128.33 | 135.45 | 129.16 | 118.74 | 116.79 | 113.11 | 107.43 | 111.51 | 121.65 | 115.75 | 111.38 | 114.62 | 116.19 | 106.51 | 104.97 | 100.23 | 106.72 | 106.21 | 109.2 | 108.31 | 106.48 | 100.88 | 97.82 | 91.04 | 86.38 | 94.31 | 112.82 | 111.26 | 104.4 | 95.96 | 94.23 | 89.35 | 83.57 | 91.14 | 91.82 | 100.16 | 94.09 | 98.59 | 98.78 | 86.79 | 94.29 | 97.76 | 112.26 | 108.26 | 102.81 | 105.63 | 107.77 | 107.24 | 100.6 | 91 | 92.53 | 100.15 | 118.47 | 123.13 | 128.4 | 132.58 | 99.85 | 102.47 | 99.14 | 95.22 | 83.2 | 85.66 | 91.75 | 94.8 | 93.35 | 96.57 | 95.6 | 86.75 | 91.76 | 93.13 | 84.67 | 91.83 | 104.46 | 104.41 | 101.01 | 94.54 | 96.83 | 125.71 | 137.26 | 114.64 | 105.79 | 101.4 | 100.4 | 96.7 | 100.91 | 92.11 | 89.65 | 95.31 | 90.1 | 87.93 | 86.09 | 85.48 | 83.29 | 82.09 | 83.83 | 79.2 | 76.66 | 78.1 | 79.39 | 85.29 | 73.37 | 72.51 | 74.38 | 69.53 | 81.65 | 78.62 | 68.94 | 66.61 | 74.41 | 79.71 | 78.81 | 68.95 | 67.28 | 69.25 | 59.41 | 58.5 | 62.36 | 61.55 | 58.05 | 56.25 | 59.2 | 63.62 | 70.1 | 64.27 | 73.38 | 81.26 | 91.17 | 108.84 | 111.95 | 81.78 | 72.15 | 65.7 | 66.97 | 70.41 | 67.25 | 79.87 | 78.43 | 70.22 | 75.2 | 69.36 | 65.39 |
-
-
-
- Current reading: 65.39 (↓ from 69.36)
- Leading Indicator: Rate volatility often transmits into equity volatility because discount ratesThe interest rate used to determine what a future sum of money is worth today. It accounts for the "time value of money"—the principle that a dollar today is worth more than a dollar tomorrow—and the risk that a future payment might not actually be received. More underpin asset valuations.
- Trend: Continuing to decline after the volatility spike experienced in May.
- Interpretation: The continued decline in the MOVE index suggests growing confidence in the policy and inflation outlook. Lower rate volatility generally supports both equities and credit by reducing uncertainty around financing conditions and discount-rate assumptions.
- Expected 10yr ranges (by timeframe):
-
-
| Timeframe | Low (%) | High (%) |
|---|---|---|
| 1 week | 4.37 | 4.55 |
| 1 month | 4.27 | 4.65 |
| 1 year | 3.81 | 5.11 |
Impact on Equities
-
-
-
- Equity Valuation Pressure: The 10-year Treasury yield declined modestly to 4.46%, remaining near but below the critical 4.50% threshold that has recently acted as a key valuation pressure point for equities. Higher rates decrease the present value of future earnings, and may add pressure to equity multiples — especially for long-duration growth stocks.
-
-
Normal Equity Risk Premium (ERP): the extra return investors expect for choosing stocks over “safe” Treasuries. While earnings yields provide a baseline for expected returns, the sustainability of those returns depends heavily on the composition of nominal growth.
The “quality” of the 2025 Nominal GDP was low, as the latest release of Real GDP (BEA) is only 0.48%, while inflation (GDP Price Deflator) is around 3.74%. This puts Nominal GDP (2025) at 4.24%. In other words, ~88.2% of the increase in the dollar value of the economy (Nominal GDP) in 2025 was due to higher prices. If this trend continues, then the threat of stagflationAn economic anomaly characterized by the simultaneous occurrence of stagnant growth and high unemployment alongside persistent, rising inflationary pressure. More rises. With real growth subdued and inflation doing most of the work, the quality of earnings expansion becomes a key risk for equity valuations.
-
-
-
- Fixed income yields remain increasingly competitive relative to equity earnings yields
-
- Treasuries: 3.83% – 4.90%
- IG Credit: 5.50% – 5.97%
-
- Fixed income yields remain increasingly competitive relative to equity earnings yields
-
-
→ Fixed income remains highly competitive from an income perspective, though the decline in long-term yields modestly improves the relative backdrop for equities compared with conditions seen in mid-May.
Risk Appetite
Yield Curve Summary
| Metric | (bp) | Comment |
|---|---|---|
| 2yr - 3mo | +36 | Terminal rateThe anticipated peak interest rate at which a central bank concludes a monetary tightening cycle to achieve a sufficiently restrictive policy stance. More might have been reached. |
| 10yr - 3mo | +63 | Long-term inflation persistence worries replacing recessionary risk worries. |
| 10yr - 2yr | +27 | Fairly robust signal of economic "normalization" |
| AaaAaa represents the highest rung of investment-grade corporate debt, indicating top-level creditworthiness and the lowest default risk. More - 10yr | +104 | healthy, standard spread for top-tier credit, indicating no signs of stress in the plumbing of the financial system. |
| HY-OAS | +266 | credit markets are not pricing in meaningful default risk or recession stress |
| MOVE Index | +65.39 | Rate volatility is relatively calm |
| 5Y5Y Forward Rate5Y5Y forward rate provides a market-implied view of where policy ultimately settles once cyclical forces dissipate. Importantly, it captures the destination of policy rather than its near-term trajectory, and should be interpreted as a structural anchor rather than a tactical signal. More | 2.23% | Fed policy remains restrictive relative to its longer-run equilibrium. |
| 5Y Breakeven Inflation Rate | 2.27% | Inflation expectations remain somewhat above target |
